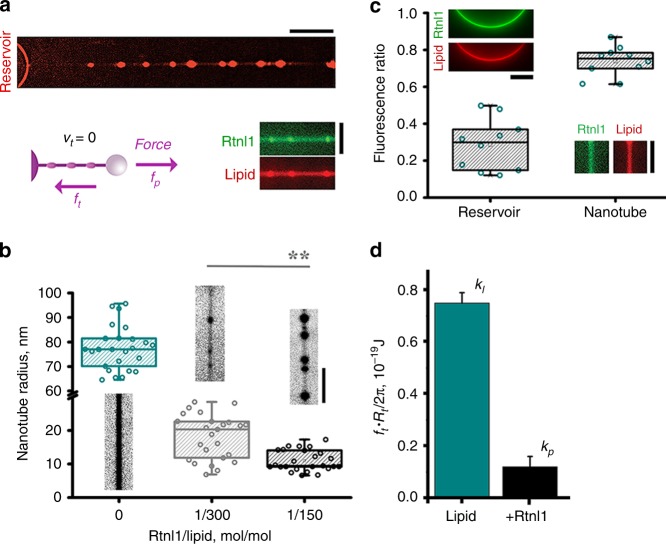
Fig. 4.
Static constriction of lipid nanotubes by Rtnl1. a Representative image of Rtnl1-constricted lipid nanotubes (Rh-DOPE fluorescence is shown) obtained with 1:150 Rtnl1/lipid (mol/mol). Scale bar 10 μm. The cartoon shows the static force balance fp = ft where the pulling force (fp) equals the tensile force (ft). The insert shows incorporation of the Alexa488-Rtnl1 (green) into the nanotube (red) at 1:150 protein/lipid. Scale bar 2 μm. b Boxplots of the radii of the control nanotubes (n = 25 tubes) and the nanotubes constricted by Rtnl1 at 1:300 (n = 25 tubes) and 1:150 (n = 25 tubes) protein/lipid ratio; 3 independent Rtnl1 preparations were used. Representative images of the nanotubes are shown above/below the boxplots (Rh-DOPE fluorescence is seen, scale bar 2 μm). Boxplots depict IQR, whiskers indicate minimum and maximum of the dataset. c Differential incorporation of GFP-Rtnl1 into reservoir and nanotube membranes (n = 8 independent nanotube/reservoir pairs). The incorporation was measured as the ratio between the GFP-Rtnl1 and lipid (Rh-DOPE) fluorescence. Images show representative examples of the reservoir membrane and a constricted part of the nanotube membrane used for calculations (GFP and Rh-DOPE fluorescence, scale bars 4 μm). Statistical significance: unpaired two-tailed t test, **p < 0.01. d Stabilization of constricted nanotubes by Rtnl1 (1:150 protein/lipid) measured as the decrease of ftRt. Mean Rt and ft values are taken from panel (b) and Supplementary Fig. 5c, respectively: for pure lipid nanotubes Rt = 77.4 ± 1.8 nm n = 25, ft = 6.9 ± 0.4 pN n = 26; for Rtnl1-containing nanotubes Rt = 10.9 ± 0.6 nm n = 25, ft = 7.6 ± 2.6 pN n = 10, where n is the number of independently formed nanotubes and errors represent SEM. Source data are provided as a Source Data file. Error bars represent SD (n = 25 tubes for the lipid column, n = 10 tubes for + Rtnl1 column).

