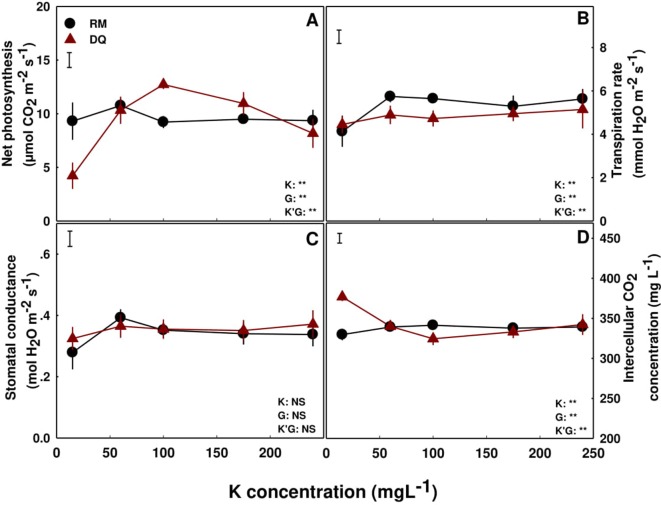
Figure 5.
Effect of K supply on gas exchange in cannabis leaves. Net photosynthesis rate (A), transpiration rate (B), stomatal conductance (C), and intercellular CO2 concentration (D) for two medical cannabis cultivars, RM and DQ. Presented data are averages ± SE (n = 5). Results of two-way ANOVA indicated as **P < 0.05, F-test; NS, not significant P > 0.05, F-test. The bars represent the LSD between means at P ≤ 0.05. In the ANOVA results K'G represents the interaction between K and genotype.

