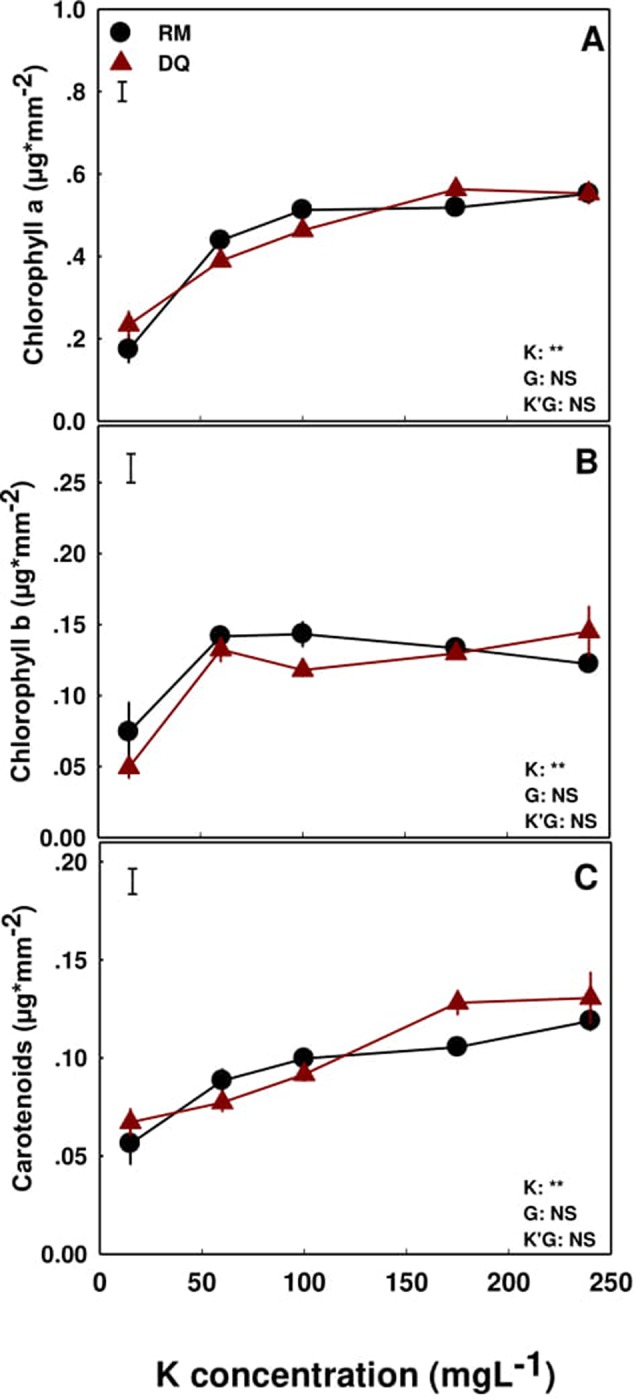
Figure 7.

Effect of K application on the concentration of photosynthetic pigments in two medical cannabis cultivars, RM and DQ. Chlorophyll a (A), chlorophyll b (B), and carotenoids (C). Presented data are averages ± SE (n = 5). Results of two-way ANOVA indicated as **P < 0.05, F-test; NS, not significant P > 0.05, F-test. The bars represent the LSD between means at P ≤ 0.05. In the ANOVA results K’G represents the interaction between K and genotype.
