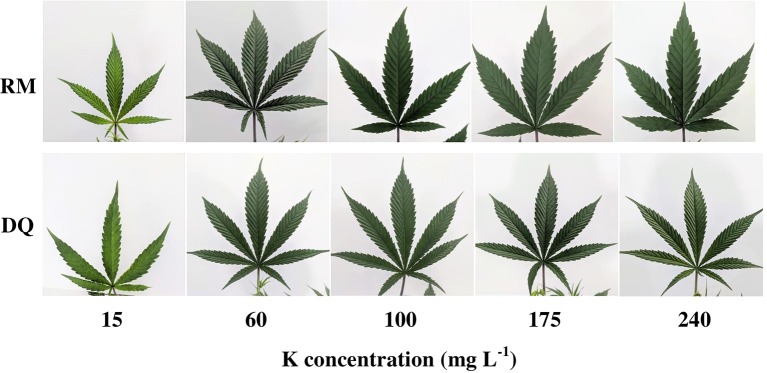
Figure 9.
Visual appearance of leaves of two medical cannabis cultivars, RM (top row) and DQ (bottom row), which developed on plants receiving increasing K supply. From left to right: 15, 60, 100, 175, and 240 ppm K. Images of the youngest fully developed leaf on the main stem, taken 26 days after the initiation of the fertigation regime.

