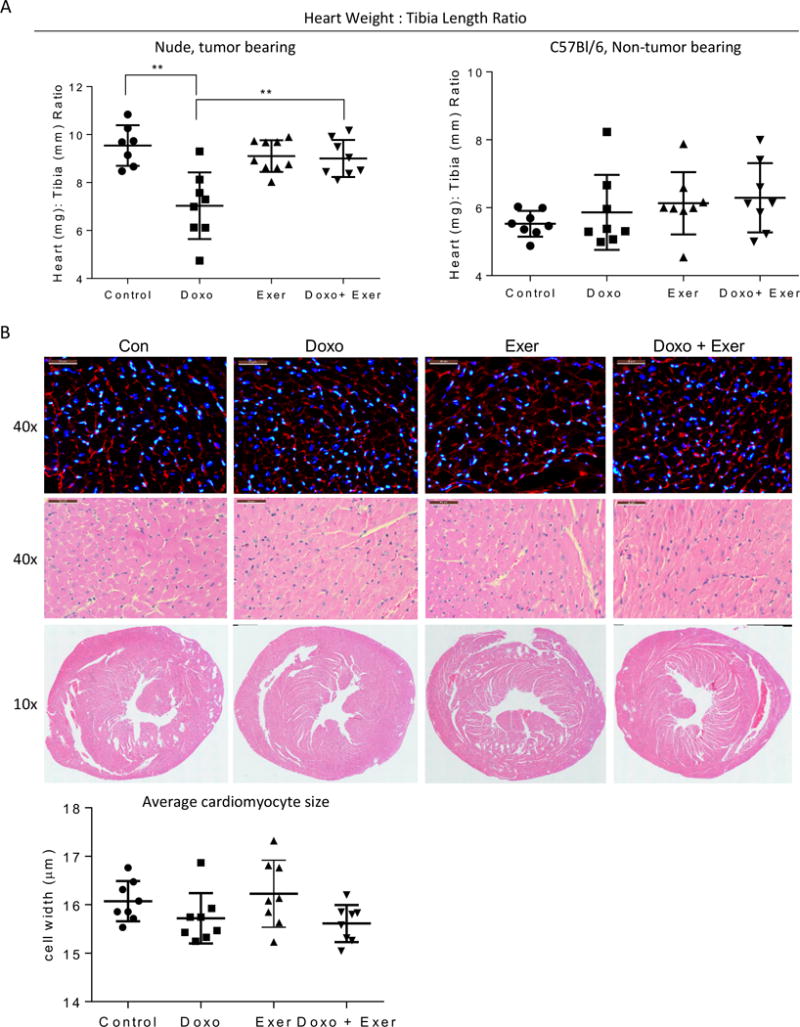
Figure 2. Doxorubicin induced heart weight reduction is rescued by exercise.

A) At euthanasia, wet heart weight (mg) and tibia length (mm) was measured for each animal. Graphs show the mean heart weight: tibia length +/− standard deviation per treatment group, graphed as nude, tumor-bearing and C57Bl/6 mice. Each symbol represents the value for one mouse. B) Representative H & E staining and DAPI/WGA staining of heart sections from each treatment group of nude, tumor-bearing mice at high magnification (40×) and low magnification (10×). The average width of 100 cardiomyocytes per heart were used to obtain one value per heart, depicted in the graph.
