
Figure 3. Doxorubicin reduced heart function is rescued by exercise as detected by echocardiogram.
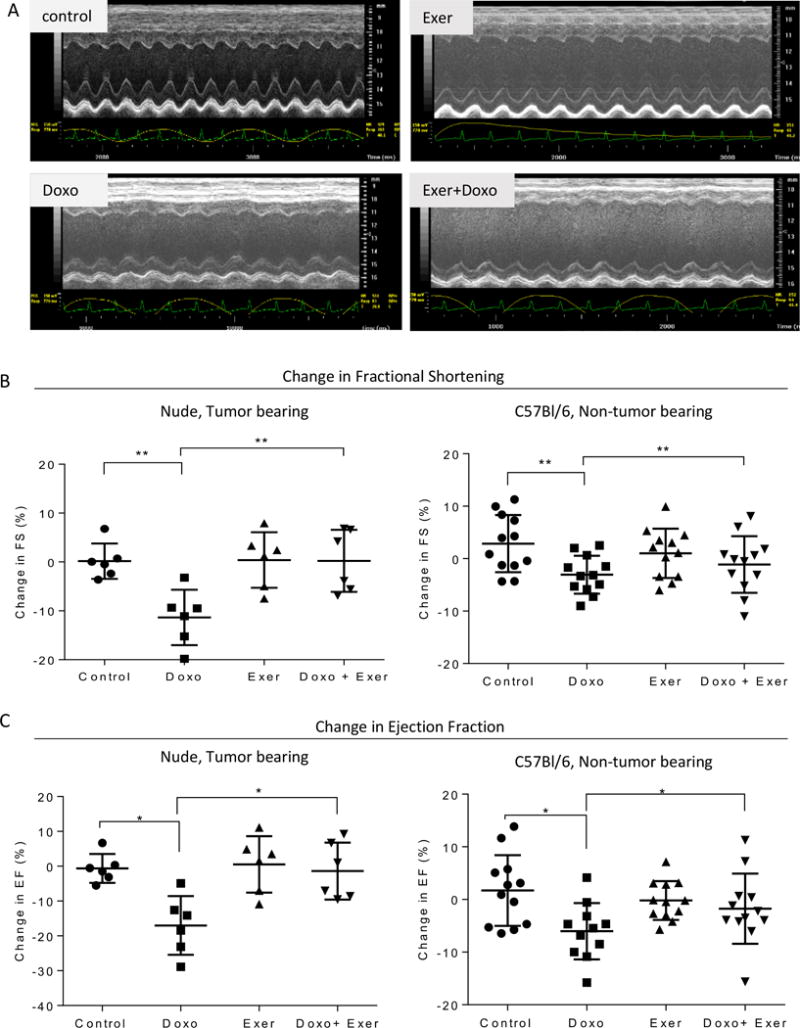
A) Representative echocardiograms performed on hearts of animals from each treatment group of TB-NM. B) Graphs show the mean difference in starting and final fractional shortening per treatment group +/− standard deviation, separated by TB-NM or NTB-IC, respectively. N = 6-12 per group. Each symbol represents the value for one mouse. C) Graphs show the mean difference in starting and final ejection fraction per treatment group +/− standard deviation, separated by TB-NM or NTB-IC, respectively. N = 6-12 per group. Each symbol represents the value for one mouse.