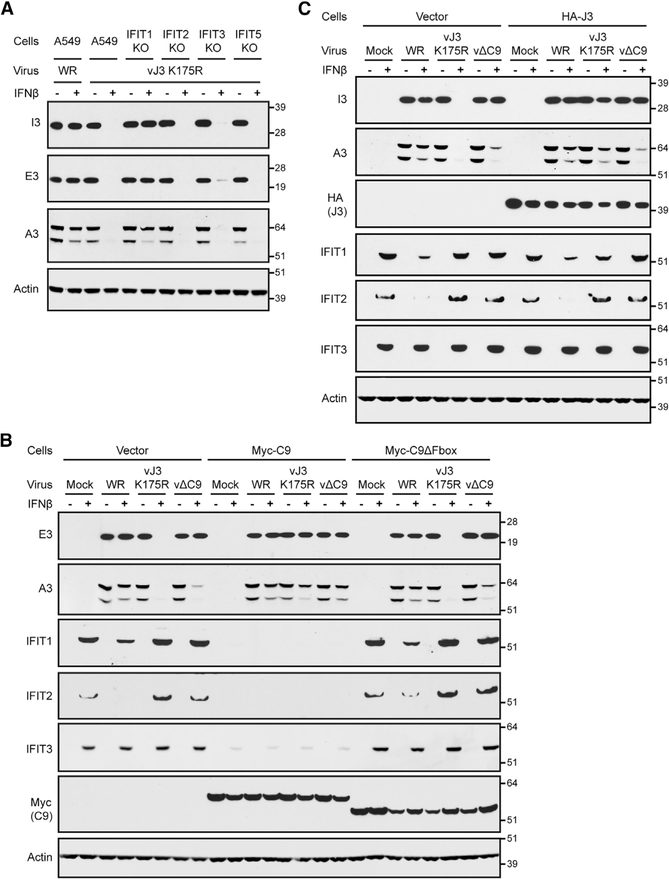
Figure 6. Comparison of IFN Resistance of Cap 1 MTase and C9-Deletion Mutants.
(A) IFN resistance of VACV MTase mutant in IFIT1 KO cells. Untreated (−) or IFN-β-pretreated (+) A549 and IFIT KO cells were infected with 3 PFUs per cell of VACV WR or the VACV cap 1 MTase mutant vJ3K175R. After 8 h, lysates were analyzed by WB.
(B) IFN resistance of VACV MTase mutant in cells expressing Myc-C9. Untreated (−) or IFN-β-pretreated (+) A549 cells and A549 cells expressing the vector, Myc-C9, or Myc-C9ΔF-box were mock infected or infected with 3 PFUs per cell of the indicated viruses. After 8 h, lysates were analyzed by WB.
(C) IFN resistance of VACV MTase mutant in cells expressing HA-J3. Untreated (−) or IFN-β-pretreated (+) A549 cells and A549 cells expressing HA-J3 were mock infected or infected with 3 PFUs per cell of the indicated viruses. After 8 h, lysates were analyzed by WB.
Representative blots from three biological repeats in (A) and (B) and two in (C).

