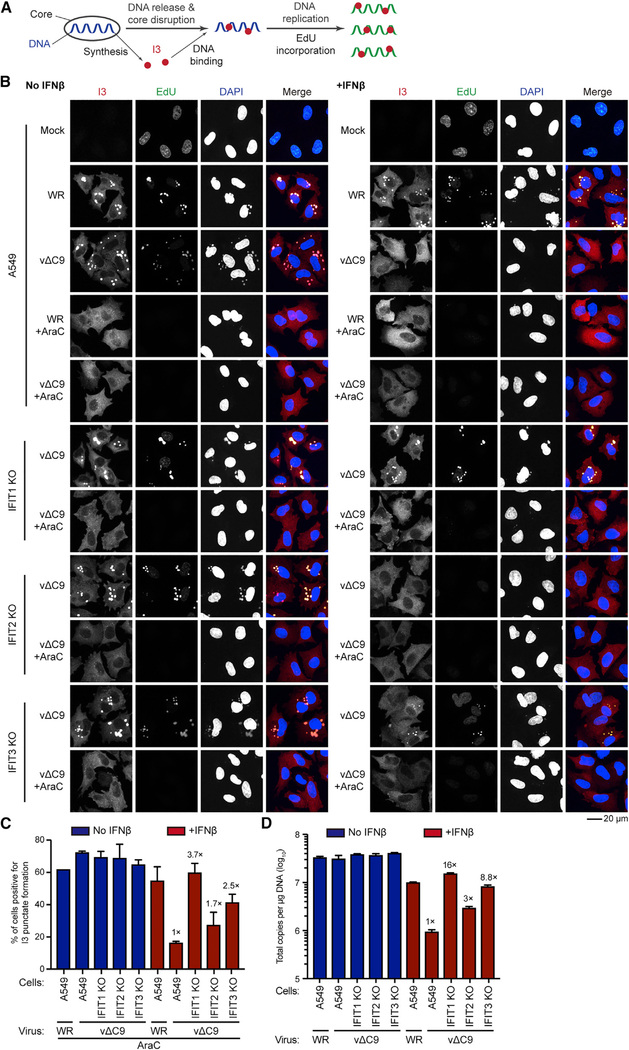
Figure 7. Restoration of VACV DNA Replication in IFN-β-Pretreated IFIT1 and IFIT3 KO Cells.
(A) Illustration of virion core synthesizing mRNAs encoding I3 and additional proteins leading to the uncoating and replication of the viral genome. I3 co-localizes with genomes released from the core and newly replicated DNA labeled with EdU.
(B) Fluorescence confocal microscopy images. A549 and IFIT KO cells were mock infected or infected in the absence or presence of IFN and AraC for 3 h and then incubated with 10 μM EdU for 1 h. Individual fluorescence channels are shown in grayscale and the merge in colors (EdU, green; I3, red; DAPI, blue). The images are from two biological repeats. Scale bar: 20 μm.
(C) The percentage of AraC-treated cells positive for I3 punctae relative to the total number of cells expressing I3. Fold increases in the numbers of vΔC9-infected IFIT KO cells relative to A549 cells positive for punctae are shown. Error bars: SEM.
(D) Viral DNA replication. Untreated or IFN-β-pretreated A549 and IFIT KO cells were infected in triplicate with 3 PFUs per cell for 6 h. Viral DNA quantified by ddPCR. Fold increases in DNA copies of IFIT KO cells relative to A549 cells infected with vΔC9 shown. Error bars: SEMs.

