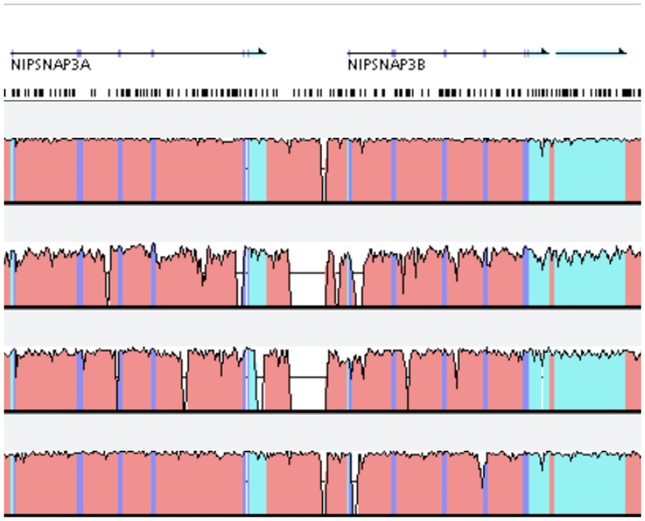
Figure 18:
Multiple sequence alignment displayed with area charts using VISTA [MBS*00]. Colors indicate if the conserved region belongs to an exon (dark blue), an untranslated region (light blue) or to a non-coding region (red).
D =  ; C =
; C =  ; T =
; T =  ; V =
; V = 

