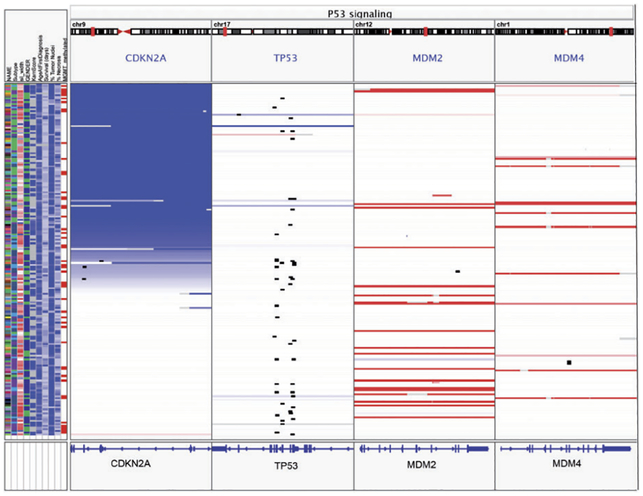
Figure 9:
The Integrative Genomics Viewer (IGV) is an example of a genome browser that can show multiple scales and foci in separate views. Moreover, the visualization includes a strongly linked utility view in form of a column next to the tracks showing meta data. Figure from [TRM13].
Data: D =  ; Coordinate System: C =
  ; Tracks: T =
  ; Views: V =

