Fig. 2.
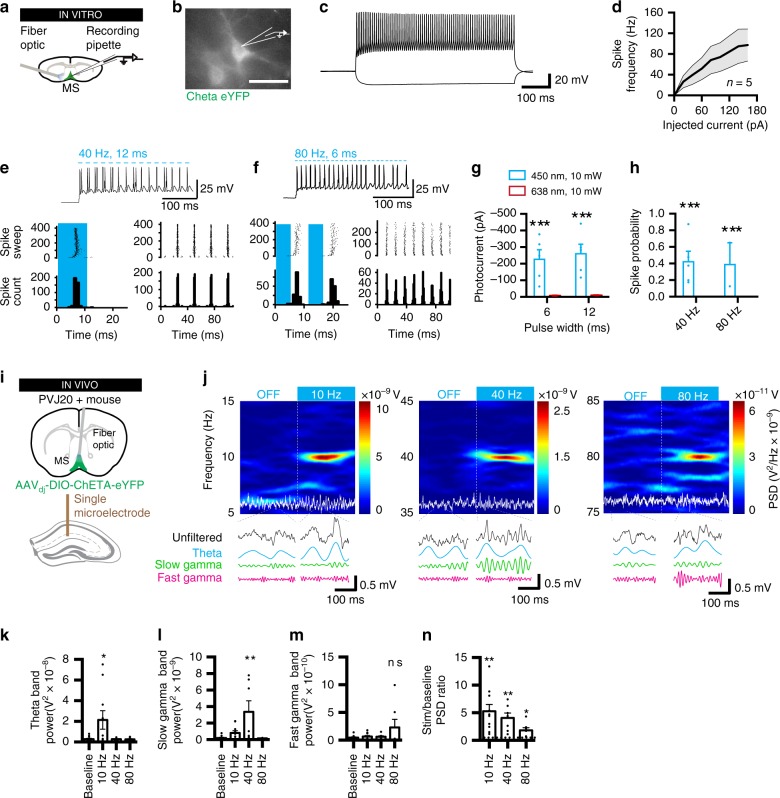
Optogenetic control of medial septum parvalbumin cells can increase gamma oscillations in PVJ20+ mice. a In vitro recording configuration. b Example eYFP-ChETA + MSPV neuron visually identified. Scale bar: 50 μm. c Fast-spiking response of MSPV cell in response to injected current in current clamp. d Average spike frequency of identified eYFP-ChETA + MSPV neurons in response to current injection. e Example trace of neuron in response to 40 Hz, 50% duty-cycle light stimulation (top) and associated spike timing histogram in response to each pulse (bottom). f Same for 80 Hz, 50% duty-cycle stimulation. g Photocurrents in response to either 450 or 638 nm (control), 6 or 12 ms, 10 mW laser stimulation. h Spike probability for 40 and 80 Hz laser stimulation. n = 5 neurons are used in d. i, In vivo recording configuration. j Spectrogram before and during 10, 40, or 80 Hz optogenetic stimulation with raw traces (white) supperimposed. Effects of optogentic stimulation on theta k, slow gamma l, and fast gamma m band power. n Ratio of stimulation/baseline PSD for each stimulation frequency. In k–n, n = 10 PVJ20+, ChETA mice were used to test 10 Hz stimulation, n = 7 PVJ20+, ChETA mice were used to test 40 Hz stimulation, and n = 7 PVJ20+, ChETA mice were used to test 80 Hz stimulation. Color codes for j: blue, low power; red, high power. Data expressed as mean ± SEM. ns, not significant. *, p < 0.05; **, p < 0.01; ***, p < 0.001. Test used in g, h: 2 ANOVA, Sidak’s multiple comparisons post hoc test; k–n: 1ANOVA, Holm–Sidak’s multiple comparisons post hoc test. Source data are provided as a Source Data file.

