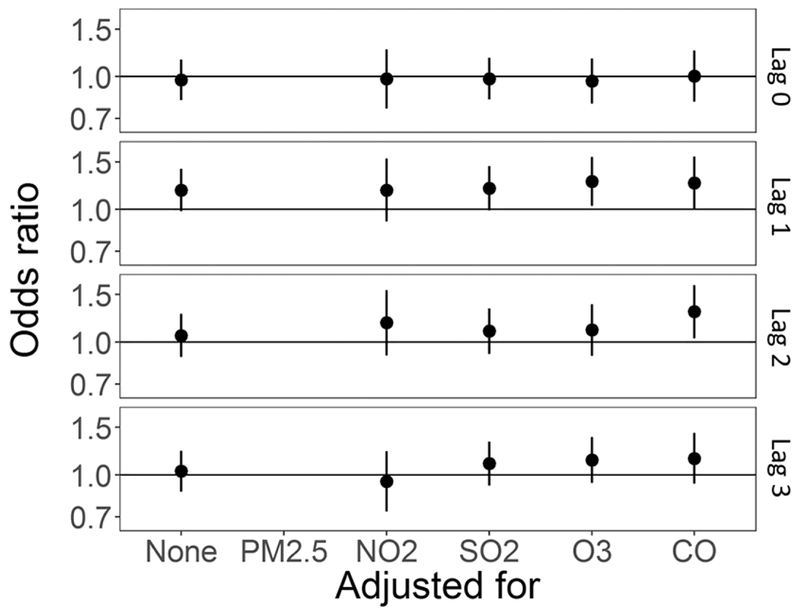
Figure 7:
Co-pollutant adjusted odds ratios and 95% confidence intervals for 5 μg/m3 (4 μg/m3 for lag 0–1) increase in daily average PM2.5 and out-of-hospital sudden unexpected death in Wake County North Carolina March 1, 2013 to February 28, 2015, also adjusted for average temperature and relative humidity. Each panel is for a single day lag: 0, 1, 2, and 3 from top to bottom, odds ratio unadjusted for other co-pollutants is furthest to the left, followed by odds ratio adjusted for NO2, SO2, O3, and CO.

