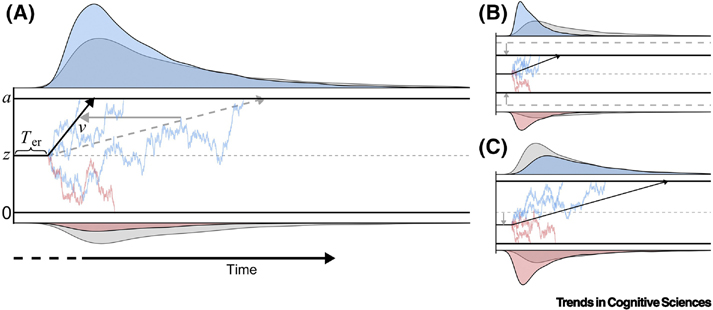
Figure I. Illustration of DDM Parameters and Their Effects.
The grey distributions in each panel are identical and depict the results of the same parameter settings (i.e., weak drift rate, wide decision threshold, and no starting point bias). Thus, each panel illustrates how choice probabilities and RT distributions are differentially impacted by (A) strengthening the drift rate (v), (B) reducing the decision thresholds (a), or (C) including a starting point bias (z).

