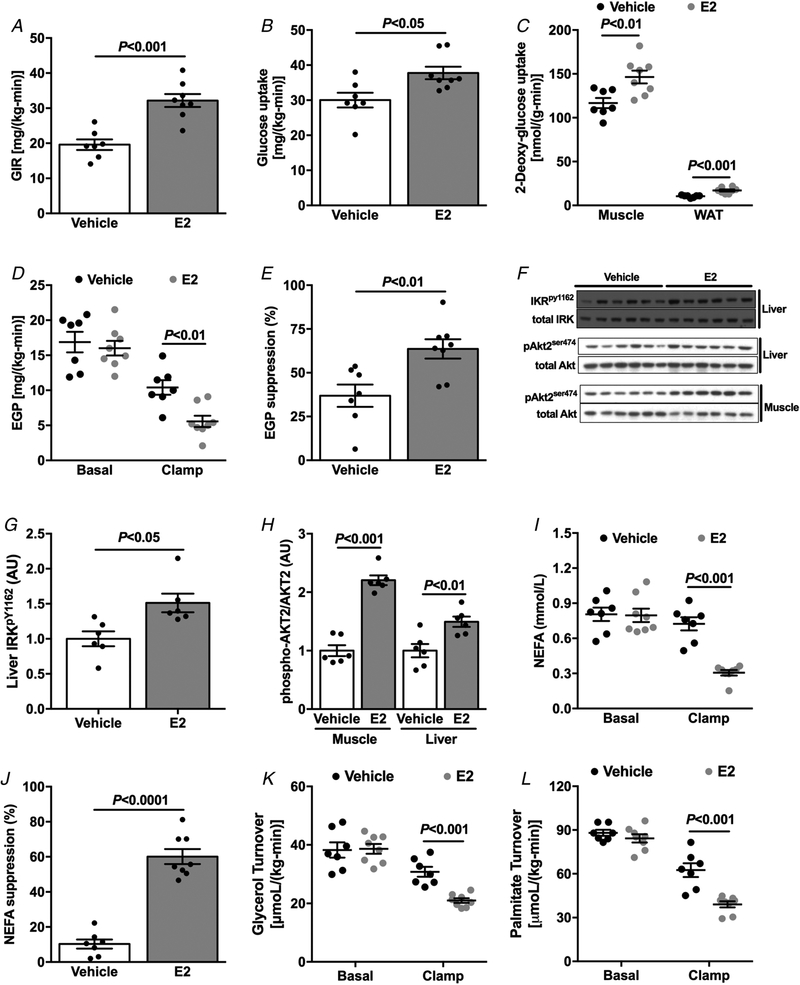
Figure 5. Oestradiol-treated male mice are protected against HFD-induced insulin resistance.
A, average of GIR during the steady-state (last 40 min) of the hyperinsulinaemic–euglycaemic clamp. B, whole-body glucose uptake (Rd) during the hyperinsulinaemic–euglycaemic clamp. C, tissue specific 2-deoxyglucose uptake during the hyperinsulinaemic–euglycaemic clamp. D and E, endogenous glucose production and suppression (%) during basal and hyperinsulinaemic–euglycaemic clamp. F–H, western blot images and quantification for insulin-stimulated IRK tyrosine1162 phosphorylation and Akt2 phosphorylation. I and J, non-esterified fatty acids (NEFA) and suppression (%) during basal and hyperinsulinaemic–euglycaemic clamp. K and L, glycerol and palmitate turnover during basal and hyperinsulinaemic–euglycaemic clamp. Data are means ± SEM.

