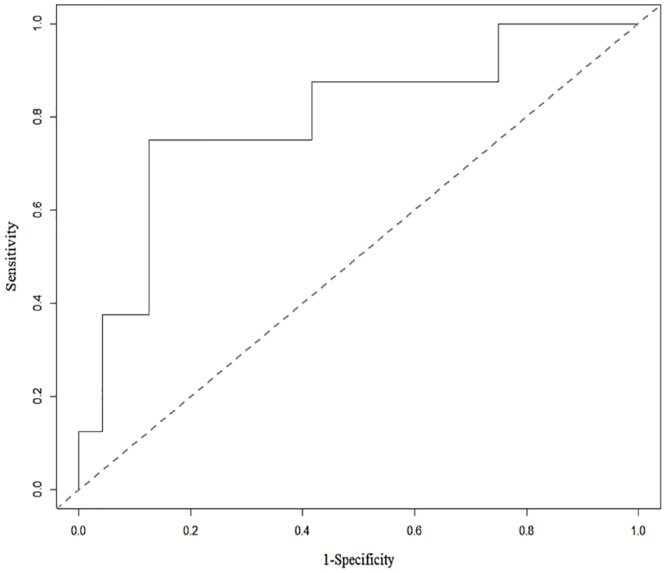
Fig 2. ROC curve for two radiomics features tested using the test dataset: SUVmax + GLZLM_SZLGE.

The value shows that the classification based on texture analysis has good predictive value, as the area under the ROC curve is 0.80.

The value shows that the classification based on texture analysis has good predictive value, as the area under the ROC curve is 0.80.