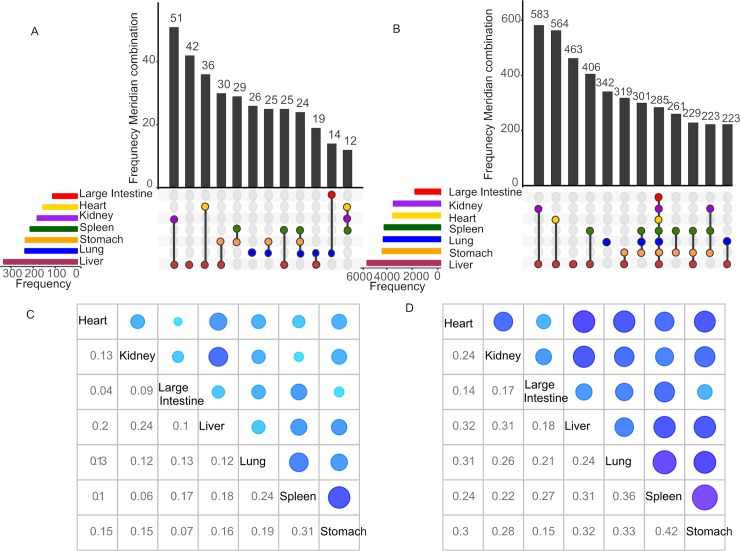
Fig 2. Herb-Meridian and Compound-Meridian distributions.
(A-B) The color bars at the bottom left represent the frequency of herbs or compounds for each of the seven major Meridians, which can be further collapsed into subclasses depending on whether an herb or a compound is shared by one or several Meridians. The vertical bars show the frequency of herbs or compounds for a particular subclass of Meridian combination, as indicated by the connected lines below the x-axis between the Meridians. (C-D) The Jaccard coefficients between the Meridian pairs at the herb and the compound levels. The size of blue circles on the upper diagonal shows the degree of the similarity.

