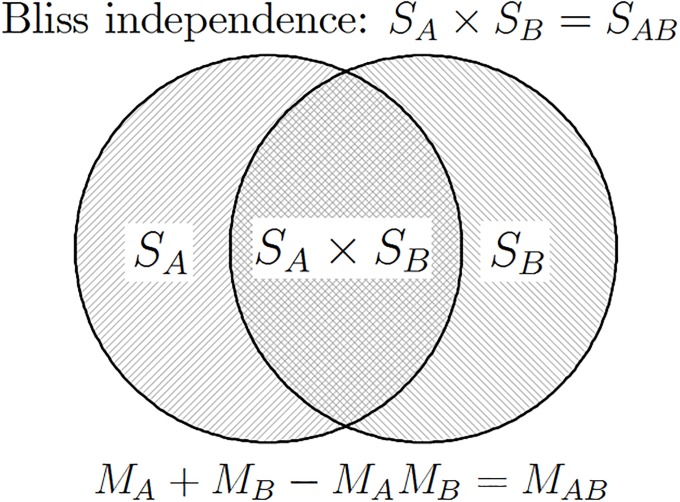
Fig 1. Geometrical illustration of drug independence according to Bliss (M = mortality, S = survival, M = 1 − S).
The two circles depict surviving fractions in the population of cells upon single-agent administration of either drug A or drug B, denoted SA and SB, respectively. When administered in combination, drug B only affects cells that survived drug A (and vice versa). Therefore, if drugs act independently, the surviving fraction of cells following treatment with the drug combination is the product: SA × SB.

