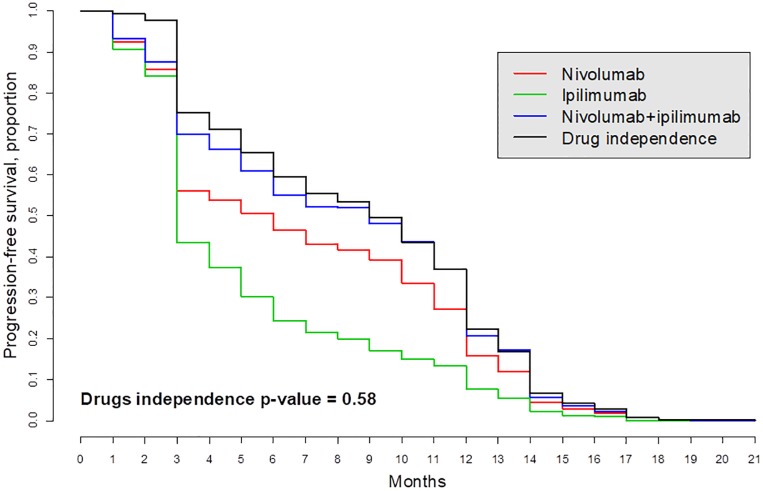
Fig 8. Kaplan-Meier survival curves in “Intention-to-treat population” for treatment metastatic melanoma patients with ipilimumab (drug A) and/or nivolumab (drug B); see [49].
The survival curve “Drug independence” is computed by formula (12). This curve basically overlaps with the observed survival curve SAB (blue) which means that the hypothesis of independence cannot be rejected.

