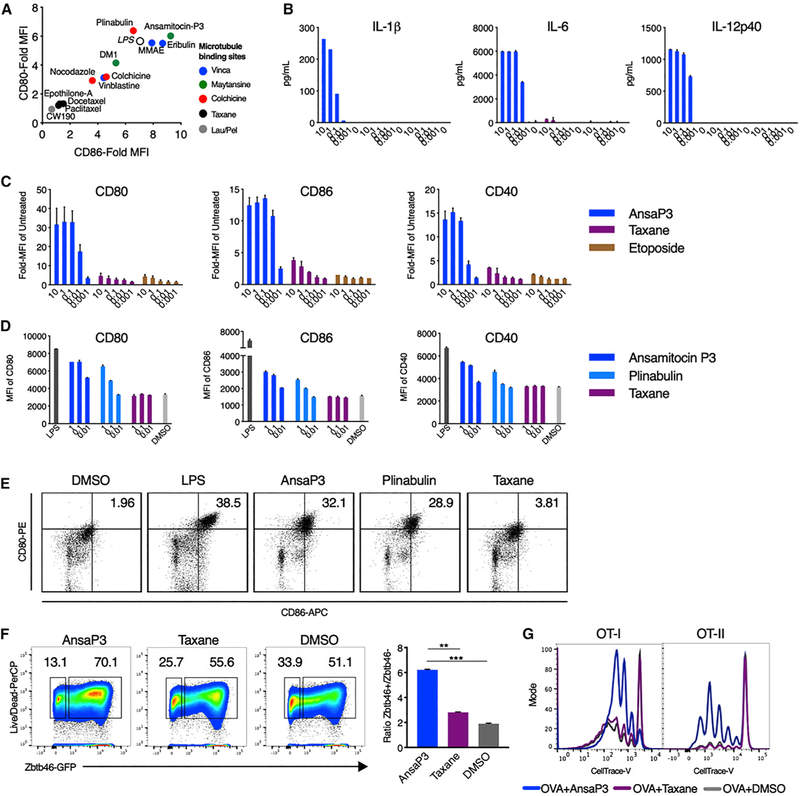
Figure 1. Microtubule Destabilization, but Not Stabilization, Induces DC Maturation.
(A) SP37A3 cells were treated with various drugs at 100 nM or LPS at 500 ng/mL. CD80 and CD86 expression was assessed after 20 h using flow cytometry and expressed as fold-mean fluorescence intensity (MFI) of 0.1% DMSO. n = 3 biological replicates.
(B) Quantification of cytokines (in picograms per milliliter) using ELISA from supernatant of SP37A3 cells treated for 20 h at indicated concentrations (in micromolars). n = 2 biological replicates.
(C) Surface expression of CD80, CD86, and CD40 on cells from (B) was assessed using flow cytometry.
(D) Splenic DCs from C57BL/6N mice were treated with LPS (200 ng/mL), ansamitocin-P3, plinabulin, and taxane at indicated doses (in nanomolars), or 0.1% DMSO. The MFI of CD80, CD86, and CD40 was assessed after 20 h by flow cytometry. n = 2 biological replicates.
(E) Dot plots and percentage of CD80 and CD86 double-positive cells from live CD11c+MHC-II+ DCs from (D) are depicted. Representative plots from four biological replicates are indicated.
(F) BMDCs from Zbtb46-GFP mice were cultured with ansamitocin-P3, taxane, or 0.1% DMSO for 24 h, and Zbtb46 expression (GFP) was assessed by flow cytometry (gating: CD11c+MHCII+GFP+). The bar graph represents the ratio of Zbtb46hi versus Zbtb46low cells. **p < 0.01, ***p < 0.001; n = 3 mice.
(G) SP37A3 cells pretreated with 100 nM ansamitocin-P3, taxane, or 0.1% DMSO were pulsed with OVA protein and cocultured with OT-I (1:20 DC:T cell) or OT-II (1:15 DC:T cell) T cells labeled with CellTrace violet dye. Dye dilution in OT-I/OT-II cells was assessed using flow cytometry after 72 h. Representative overlapping histograms are presented.
Experiment was repeated three times with similar results. Error bars represent SD. See also Figure S1.

