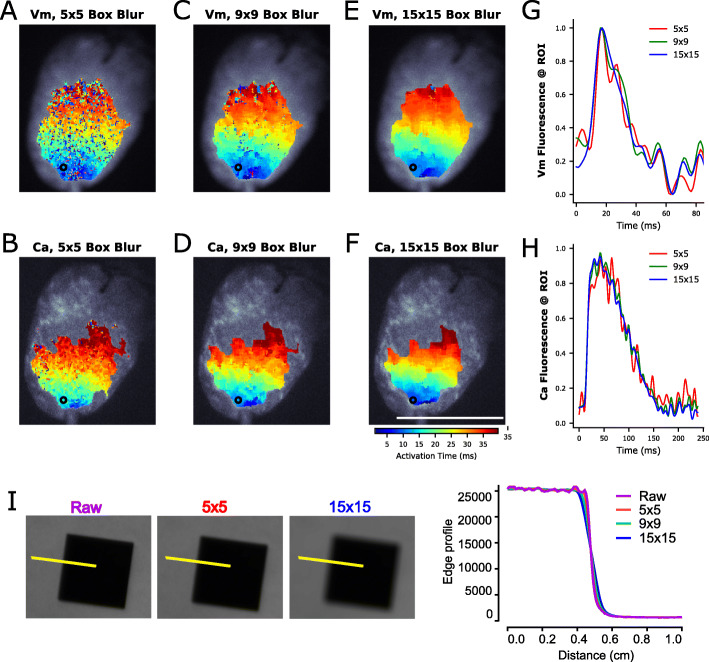
Fig. 5.
Spatial filtering of optical signals using box blurring. The fluorescence intensity of each pixel is averaged with neighboring pixels. a-f 384 × 256 pixel images were convolved with an odd uniform kernel for box blurring to improve SNR for isochrone analysis. Salt and pepper noise is decreased with increasing kernel size for both Vm (top) and Ca (bottom) signals. g, h Traces show increased SNR with increasing kernel size. Note: The displayed signal is measured from a single pixel (ROI = region of interest), whereas typically for signal analysis an averaged region of interest is used consisting of several pixels from images that have not been box blurred. i Spatial resolution is demonstrated in the raw image (purple), 5 × 5 box blurred image (red) and 15 × 15 box blurred image (blue). Corresponding edge profile trace illustrates spatial resolution of approximately 0.8 mm (raw, 5 × 5 box blurring), 0.86 mm (9 × 9 box blurring) to 1.2 mm (15 × 15 box blurring). Scale bar = 1 cm

