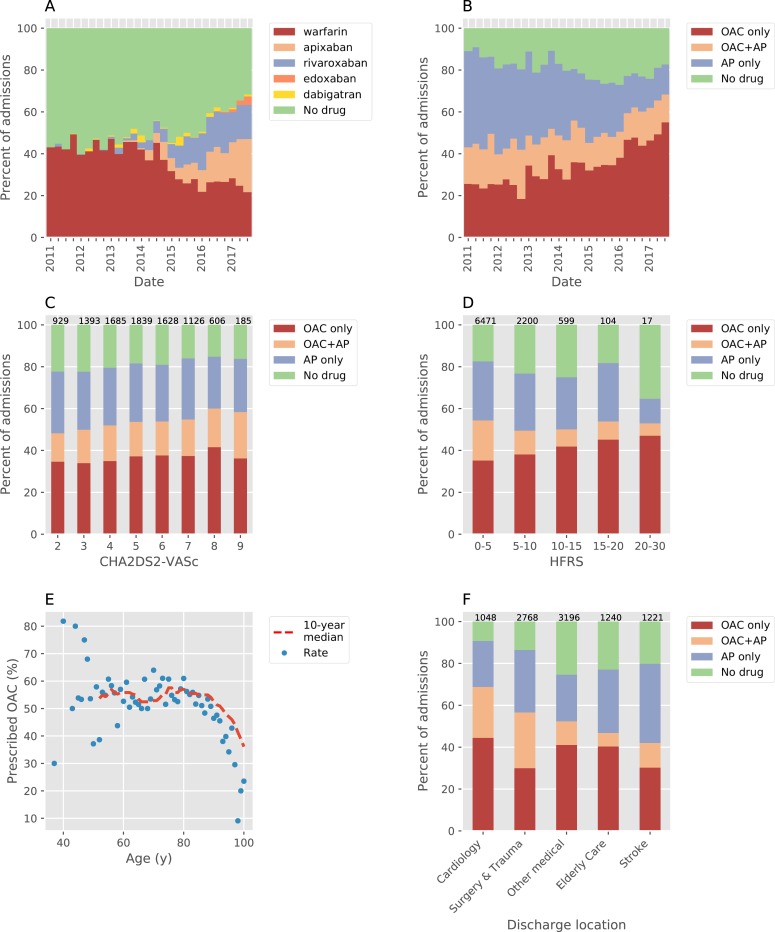
Fig 2. Antithrombotic drug prescribing patterns in the AF cohort patients with CHA2DS2-VASc ≥ 2.
A,B) Prescribing rates for all admissions during the study period. A) OAC choice vs. no OAC. B) Prescribing of OAC and/or AP vs. neither. C) Prescribing rates stratified by CHA2DS2-VASc for all patients. D) Prescribing rates grouped by HFRS as defined by Gilbert et al. Due to low numbers of patients with score > 20 the final (highest) bin is wider than the others. E) Prescribing rate vs. age at discharge. Points are the mean prescribing rate per year for all ages with ≥ 10 patients, a 10-year moving median (trend) is shown as a dashed red line. F) prescribing rates in patients grouped by discharging specialty. In C, D, F the number above each bar indicates the number of patients. AP = antiplatelet, HFRS = hospital frailty risk score, OAC = oral anticoagulant.

