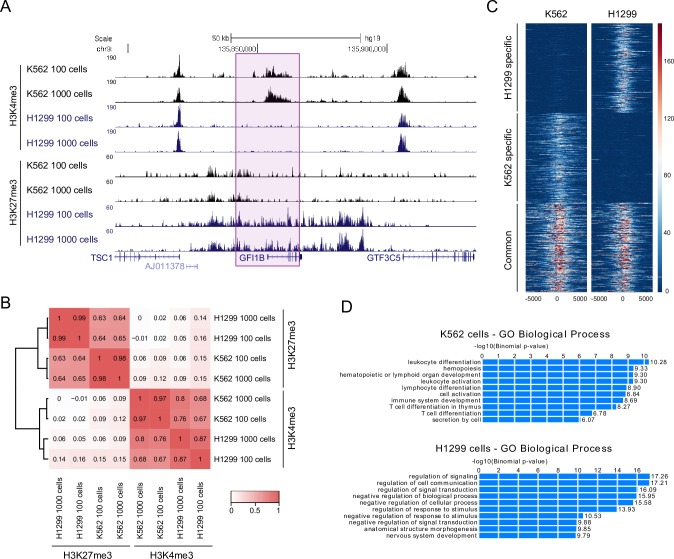
Fig 2. RAT-ChIP can identify differences in histone modifications between cell-lines.
A UCSC genome browser custom histone H3K4me3 and H3K27me3 tracks of RAT-ChIP-seq with 100 and 1,000 cells in K562 and H1299 cells. B Clustered global Pearson correlation heatmap of histone H3K4me3 and H3K27me3 datasets of K562 and H1299 cells. C Heatmap of histone H3K4me3 signal in K562 and H1299 cells in 4kb region centered around the TSS of 300 genes with either cell type specific or common signal. D Enriched terms of GREAT GO analysis of top 500 peaks differentially enriched between K562 and H1299 cells.

