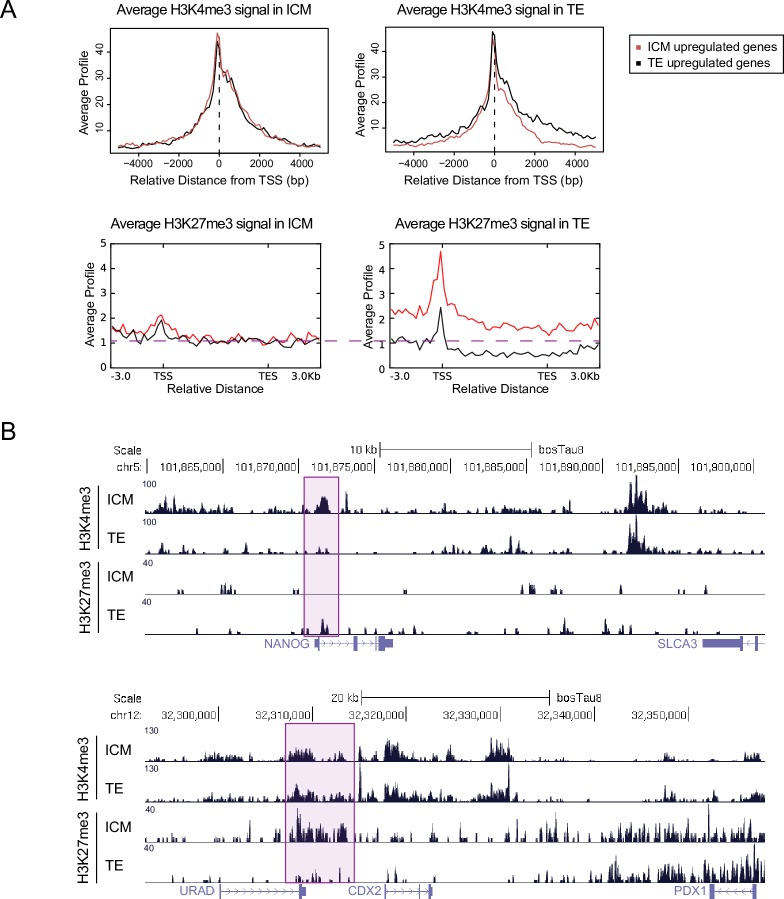
Fig 3. Histone H3K4me3 and H3K27me3 modification profiles of ICM and TE of blastocyst stage bovine embryos.
A Average histone H3K4me3 (upper panels) and H3K27me3 (lower panels) profiles around TSS of genes that are upregulated in ICM (red line) or TE (black line) in ICM (panels on the left) and TE (panels on the right). B UCSC genome browser custom histone H3K4me3 and H3K27me3 tracks of bovine blastocyst ICM and TE in NANOG (upper) and CDX2 (lower) gene regions.

