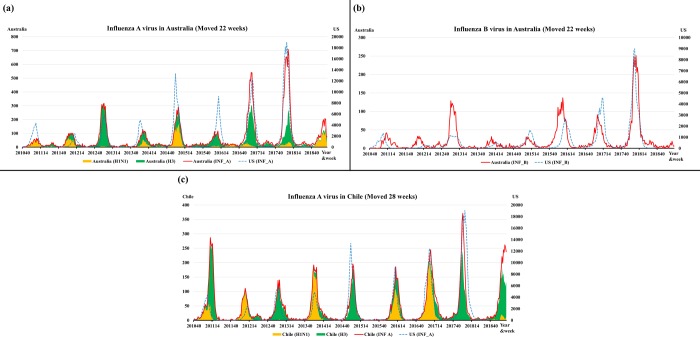
Fig 5.
The surveillance data for influenza A (a) and B (b) viruses in the U.S. and Australia; the values for Australia were shifted forward 22 weeks in 2010–2018. The surveillance data for influenza A (c) viruses in the U.S. and Chile; the values for Australia were shifted forward 28 weeks. The blank part of the graph, the gap between INF A and the sum of the H1N1 and H3 viruses, is the number of influenza viruses (not subtyped).

