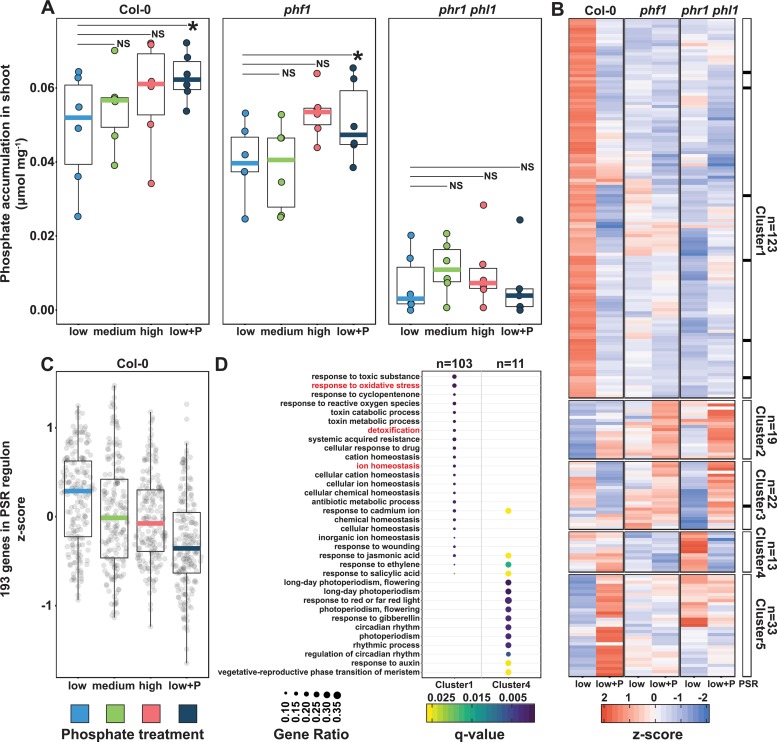
Fig 1. Plants respond to differential P conditions in soil.
(A) Free phosphate content normalized by shoot fresh weight (mmol·mg−1) across wt Col-0 plants and 2 PSR mutants, phf1 and phr1 phl1. Statistical significance between low P and low+P treatments was determined across each genotype independently by a paired t test (p < 0.05). (B) Heat map showing the average standardized expression of 210 DEGs across the low P and low+P samples in the Col-0, phf1 and phr1 phl1 genotypes. The black bar to the right highlights the distribution of 7 genes belonging to the in vitro defined PSR marker genes [4] across the 5 clusters in the heat map. (C) Average expression of 193 PSR marker genes [4] across the 4 phosphorus regimes in the Col-0 genotype. (D) GO enrichment for Clusters 1 and 4. Clusters 2, 3, and 6 did not show any statistically significant GO enrichment. The gene ratio is the proportion of genes per cluster that belong to a GO category. DEG, differentially expressed gene; GO, gene ontology; P, phosphorus; PSR, phosphate starvation response; wt, wild type.

