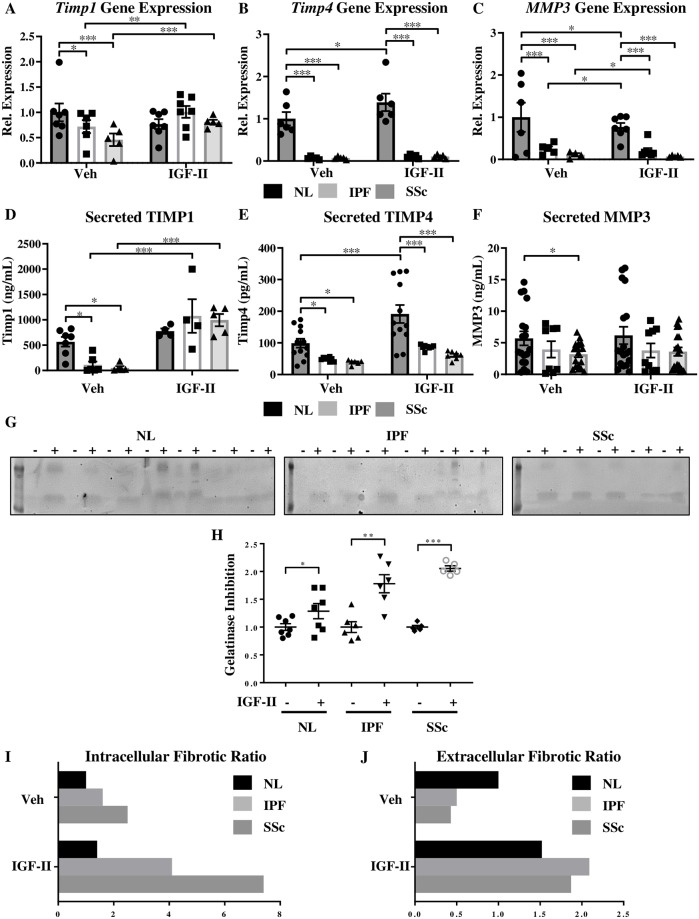
Fig 4. IGF-II promotes an intracellular and an extracellular fibrotic environment.
Transcript levels of TIMP1 (A), TIMP4 (B), and MMP3 (C) normalized to GAPDH housekeeping gene by qRT-PCR and secreted TIMP1 (D), TIMP4 (E), and MMP3 (F) levels in supernatant by ELISA in NL, IPF, and SSc fibroblasts treated with vehicle (PBS) or IGF-II (200 ng/mL) for 48 hr. N = 5–10. *p<0.05, **p<0.01, ***p<0.001 by 1-way ANOVA with Dunnett’s multiple comparison test. G: Reverse gelatin zymography of supernatants from fibroblasts treated with vehicle (-) or IGF-II (200 ng/mL, +) for 48 hr and quantification of relative gelatinase inhibition (H). Individual samples are represented with mean +/- standard error of the mean as indicated. N = 5–7. *p<0.05, **p<0.01, and ***p<0.001 by paired 2-tailed Student’s T test. Fibrotic ratios of relative TIMP1 & TIMP4 to relative MMP3 transcript (I, intracellular) and secreted protein (J, extracellular) levels in NL, IPF, and SSc fibroblasts. Ratio was calculated by taking the average of relative TIMP1 and relative TIMP4, then dividing by relative MMP3. High fibrotic ratio indicates increased ECM deposition and/or decreased ECM breakdown.

