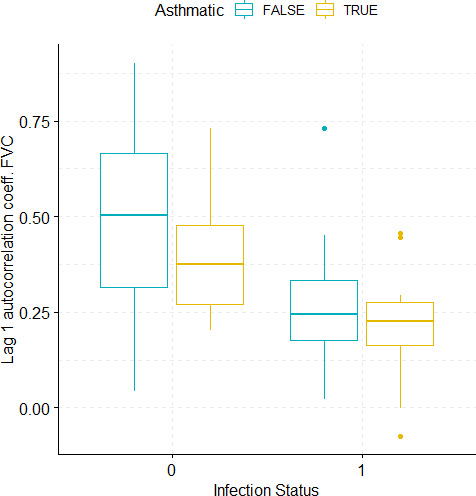
Appendix 1—figure 12. Boxplots demonstrating the distribution of autocorrelation coefficient at 1 day lag for FVC before and after viral challenge in healthy and asthma groups.

A 2-way ANOVA resulted in a significant impact of the infection status on the autocorrelation coefficient (p=0.0007).
