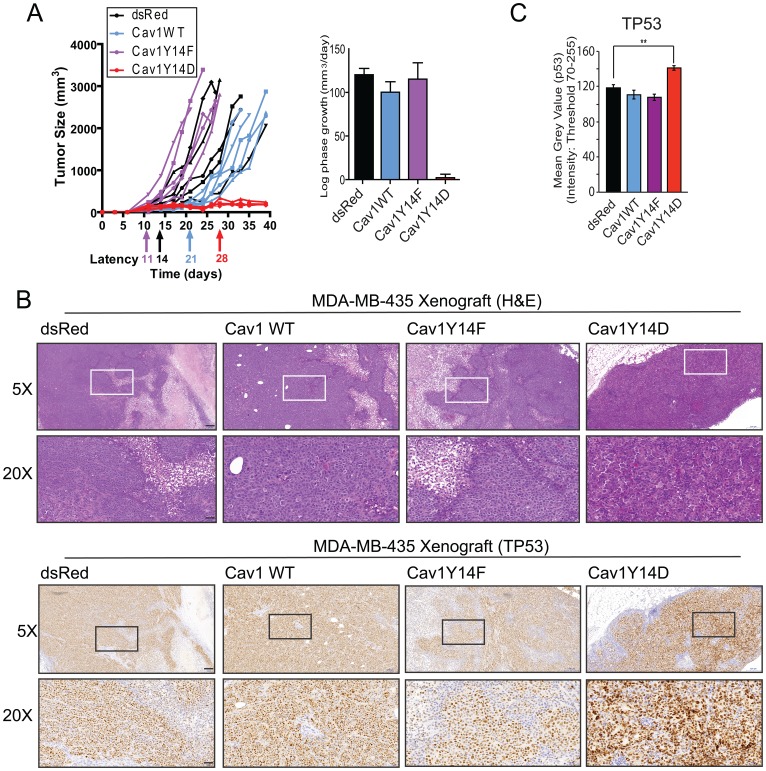
Figure 2. Tumor growth restriction of Cav1Y14D MDA-MB-435 cells.
(A) Tumor growth of the MDA-MB-435 Cav1 Y14 stables following s.c. injection in nude mice was monitored; tumor size, latency and log phase growth are presented. (B) MDA-MB-435 tumors were labeled with H&E and immunostained for TP53. (C) Mean intensity of TP53 labeling in tumors was quantified (** p < 0.01; ANOVA, Scale bar: 50 μm).

