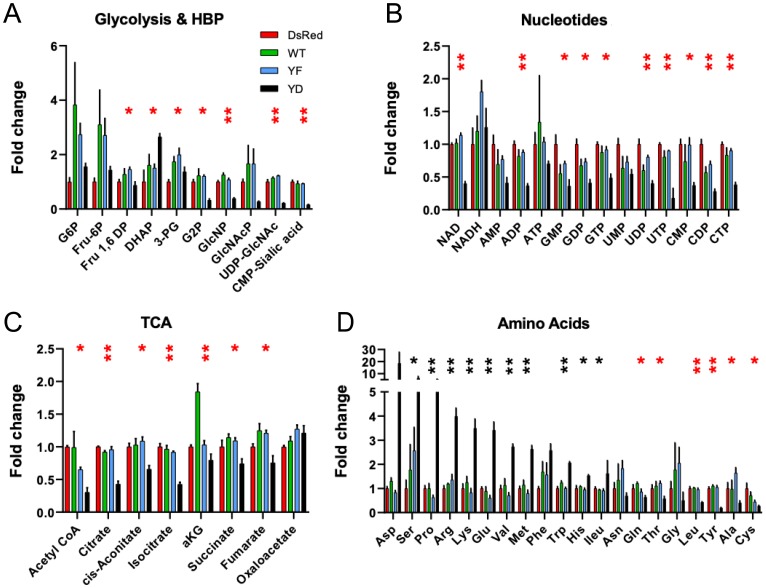
Figure 3. Metabolite profiles are consistent with slow-growth phenotype in Cav1Y14D tumors.
Soluble metabolites were prepared from dsRed, Cav1Y14F, Cav1WT and Cav1Y14D MDA-MB-435 cells and quantified by LC-MS/MS as described in Methods. Fold change of glycolytic and hexosamine biosynthesis pathway (A), TCA cycle (B), nucleotide phosphates (C) and amino acids (D) was measured by LC-MS/MS. Glucose-6-phosphate (G6P); Fructose-1,6-phosphate (Fru1,6P); Fructose6-phosphate (Fru-6P); dihydroxyacetone phosphate (DHAP), 3-phosphoglyceric acid (3PG), 2-phosphoglyceric acid (G2P), N-acetylglucosamine phosphate (GlcNAcP); Uridine diphosphate N-acetylglucosamine (UDP-GlcNAc), and α-ketoglutarate (aKG). Error bars represent SD of three biological replicates (* p < 0.05, ** p < 0.001, ANOVA; black: Y14D > dsRed, red: Y14D < dsRed).

