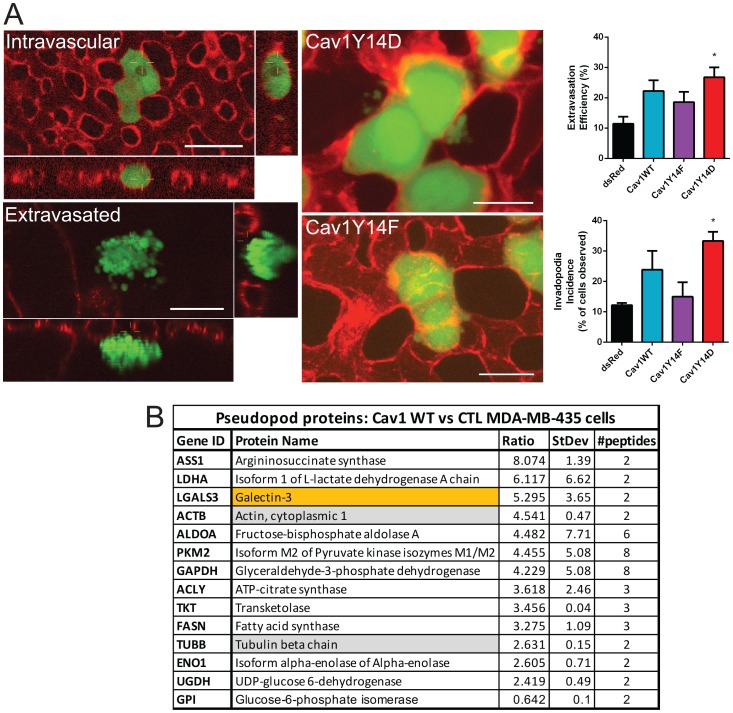
Figure 4. pCav1 promotes invadopodia formation and tumor cell invasion in vivo.
(A) GFP lentiviral infected MDA-MB-435 stable cells were intravenously injected into the chorioallantoic membrane of avian embryos (representative images of Cav1Y14F and Cav1Y14D cells are shown). Intravital images were acquired at T = 4 hrs post-IV injection of cells. Lectin-rhodamine (red) labels the luminal surface of all endothelial cells. Graphs show extravasation efficiency (% of injected cells that successfully extravasate) and invadopodia incidence (% of cells that present extravascular protrusions) of MDA-MB-435 cells expressing dsRed, Cav1WT, Cav1Y14F or Cav1Y14D (±SEM; n = 3; * p < 0.05, ANOVA; Scale bar: 10 μm). (B) Quantitative proteomic analysis of pseudopod and cell body fractions from Cav1WT expressing MDA-MB-435 vs MDA-MB-435 cells identified 11 glycolytic enzymes, actin, tubulin and galectin-3 to be enriched in the pseudopodia of the Cav1 expressing cells (See Supplementary Table 1).

