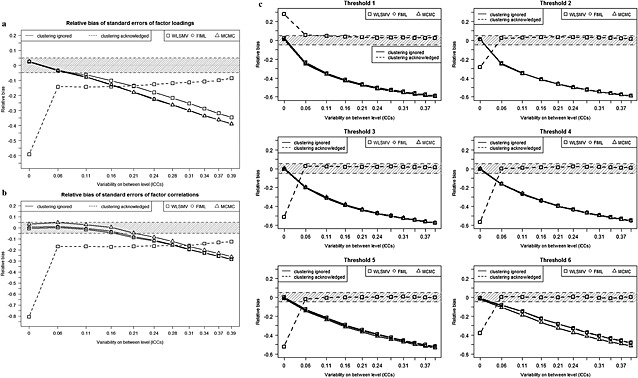
Figure 3.

Relative bias of standard errors of (a) factor loadings, (b) factor correlations, and (c) thresholds for WLSMV, FIML and MCMC estimators when clustering is ignored and for WLSMV when clustering is acknowledged [N = 1000, R = 100 (R = 64 for ICC = 0.001)]. The grey areas represent the region of acceptable bias.
