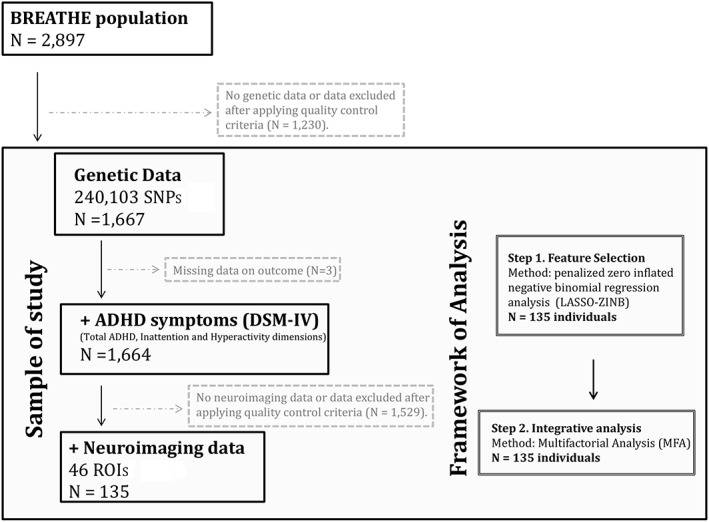
Figure 1.

Flow chart depicting the final sample size for each outcome analyzed and the analytical procedure. Solid lines and boxes represent individuals remaining in the study. Dashed lines and boxes represent individuals excluded. Reason and number of individuals excluded are indicated in dashed boxes. Double boxes indicate the analytical procedure performed. SNPs: single nucleotide polymorphisms; ROIs: brain regions of interest; ADHD: attention‐deficit/hyperactivity disorder
