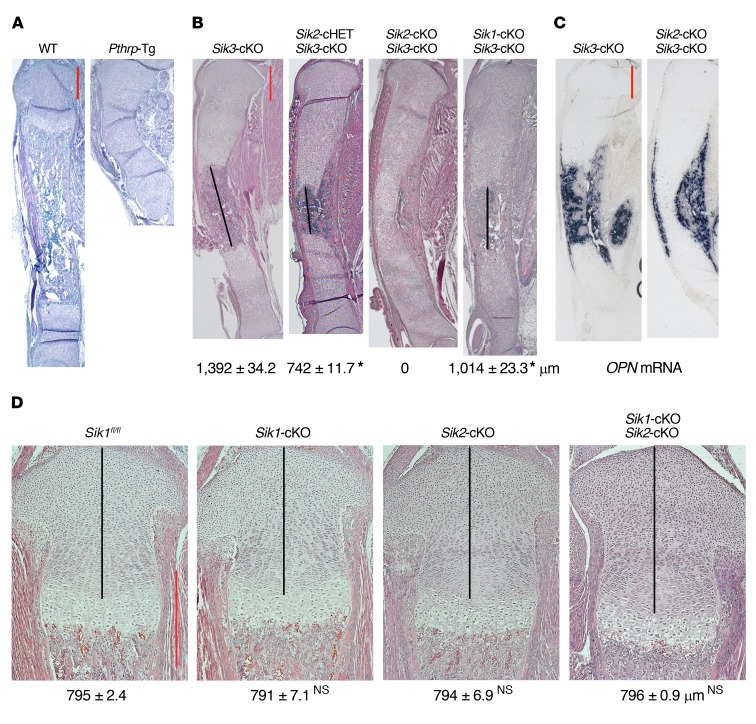
Figure 2. SIK1 and SIK2 control chondrocyte hypertrophy in addition to SIK3.
(A and B) H&E staining of whole tibia at birth (original magnification, ×20) shows that additional homozygous deletion of Sik1 or Sik2 in the Sik3-cKO mouse delays chondrocyte hypertrophy. Each mouse genotype shown is defined as follows: Sik3-cKO (Sik3fl/fl Col2a1-Cre), Sik2-cHET Sik3-cKO (Sik2fl/+ Sik3fl/fl Col2a1-Cre), Sik2-cKO Sik3-cKO (Sik2fl/fl Sik3fl/fl Col2a1-Cre), Sik1-cKO Sik3-cKO (Sik1fl/fl Sik3fl/fl Col2a1-Cre). Numbers represent average length of the bone region between proximal and distal growth plates (black lines) (mean ± SEM, n = 3, biological triplicates; we measured the average length using 6–9 sections for each mouse). *P < 0.001 by 1-way ANOVA followed by Dunnett’s test, when the Sik3-cKO measurement is control. P values less than 0.05 were considered significant. (C) In situ hybridization for osteopontin (OPN) mRNA on the whole tibia at birth (original magnification, ×20). (D) H&E staining of proximal tibial growth plate at birth (original magnification, ×100). Numbers represent the average length of the proliferating chondrocyte region (black lines) (mean ± SEM, n = 3, biological triplicates; we measured the average length using 6–9 sections for each mouse). By 1-way ANOVA followed by Dunnett’s test when the corresponding WT (Sik1fl/fl) measurement is control, we found no significant (NS) differences by knocking out Sik1 and/or Sik2. P values less than 0.05 were considered significant. SIK3 is the major mediator. SIK3 alone can exhibit normal phenotype without SIK1 and SIK2. Scale bars (red lines): 500 μm.

