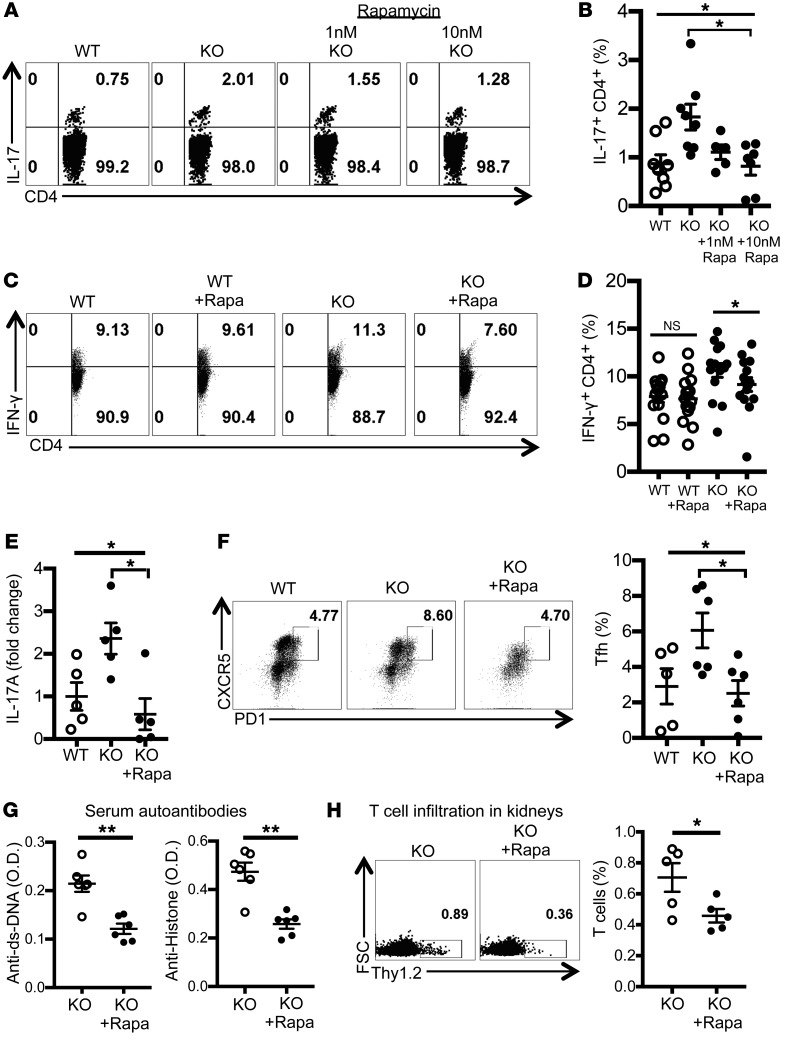
Figure 5. Rapamycin treatment reduces proinflammatory cytokine production by T cells and alleviates autoimmunity in Srsf1-cKO mice.
(A–D) Spleen cells from WT or Srsf1-cKO mice were cultured for 4 hours with PMA plus ionomycin in the presence of monensin. Rapamycin (1 nM or 10 nM) was added for the duration of cultures. Cells were collected, surface stained, fixed, and permeabilized for intracellular cytokine staining. (A and C) Plots show IL-17 and IFN-γ intracellular staining gated on live CD4+ T cells. (B) Graphs show data from n = 8 mice in 7 independent experiments. (D) Graph shows data from n = 15 mice each in 10 independent experiments. (E–H) Rapamycin (2 mg/kg) or PBS was administered to WT and Srsf1-cKO mice by intraperitoneal injection once every 2 days for 4 weeks (F and G) or every day for 1 week (E and H). (E) Spleen cells were cultured with anti-CD3 (2 μg/mL) and anti-CD28 (2 μg/mL) for 24 hours and IL-17A measured in the supernatants by ELISA. Data are shown as fold values normalized to controls (n = 5 mice in 2 independent experiments). (F) Spleen cells were analyzed by flow cytometry, and graph shows the frequency of Tfh cells in spleen (n = 5–6 mice in 2 independent experiments). (G) Serum was collected and autoantibodies measured by ELISA (n = 5–6 mice in 2 independent experiments). (H) Cells from kidneys were analyzed by flow cytometry, and graph shows the frequency of T cells in kidneys (n = 5 mice in 2 independent experiments). One-way ANOVA with Bonferroni correction (B, D, E, and F); 2-tailed unpaired t test (G and H); *P < 0.05, **P < 0.005; mean ± SEM.

