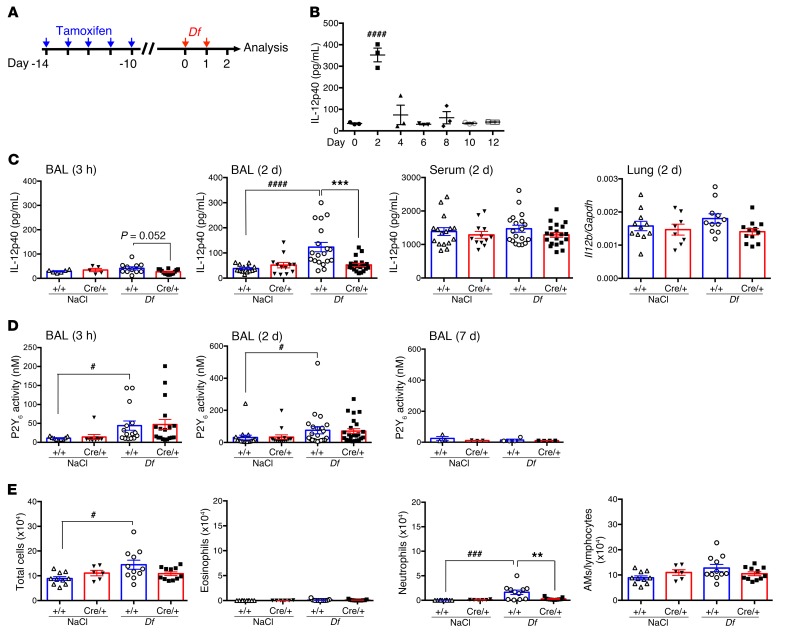
Figure 3. P2Y6 receptors regulate early alveolar IL-12 production.
(A) Schematic of BAL and serum collection during the sensitization phase to assess levels of IL-12p40 and UDP and BAL fluid cell counts. (B) Time course of IL-12p40 production in BAL fluid from Df-treated WT mice (n = 3). (C) IL-12p40 production in BAL fluid and serum from NaCl- or Df-treated +/+ (blue bars) and P2ry6fl/fl/Cre/+ (red bars) mice; and Il12b transcript in the lung of NaCl- or Df-treated +/+ and P2ry6fl/fl/Cre/+ mice on day 2. (D) P2Y6 activity (UDP concentrations) on days 0 (3 hours), 2, and 7 in BAL fluid was quantified by bioassay using 1321N1 cells stably expressing mouse P2Y6. (E) BAL fluid cell counts of NaCl- or Df-treated +/+ and P2ry6fl/fl/Cre/+ mice on day 2. Values are mean ± SEM. Data are from at least 2 experiments, except for the time course experiment on IL-12p40 (B) and P2Y6 activity on day 7 (D, right panel). #P < 0.05, ###P < 0.001 vs. NaCl treatment; ####P < 0.0001 vs. day 0 (B) or NaCl treatment (C); **P < 0.01, ***P < 0.001 vs. +/+ mice; by 1-way (B) or 2-way (C and E) ANOVA followed by Tukey’s multiple-comparisons test or nonparametric Kruskal-Wallis followed by Dunn’s multiple-comparisons test (D).

