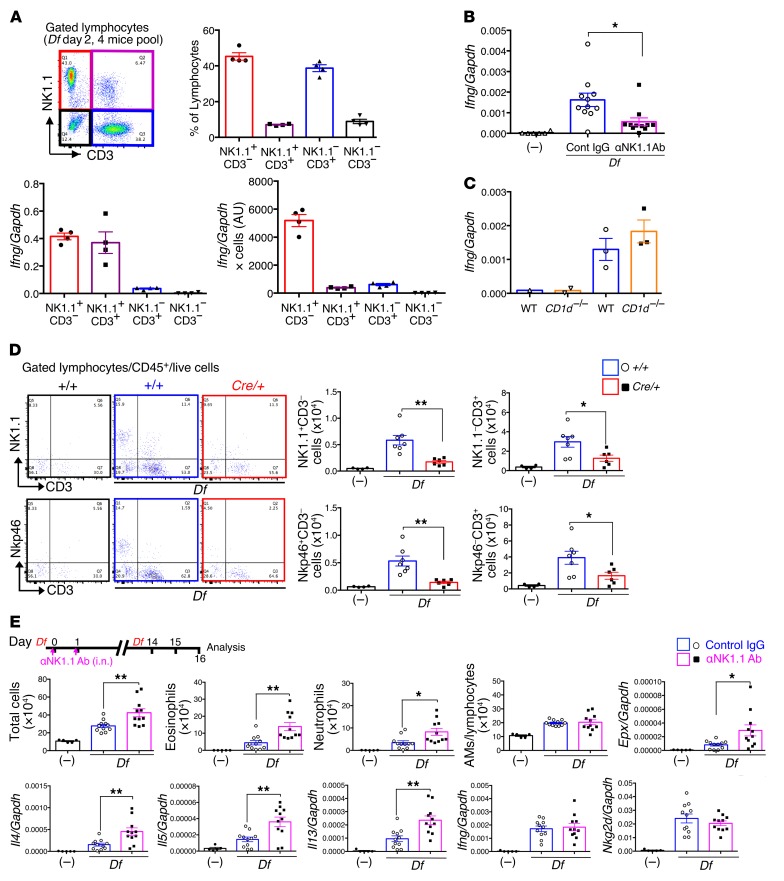
Figure 8. P2Y6 regulates the influx of protective IFN-γ–producing NK cells.
(A) Characterization of BAL fluid lymphocytes from Df-treated WT mice on day 2 (4 mice per pool). Top row: Percentages of the indicated subgroups. Bottom row: Ifng transcripts relative to Gapdh in each population after the cell sorting. Data are expressed as arbitrary units (Ifng/Gapdh × numbers of cells) (n = 4; bottom row). Data are from 2 experiments. (B) Effect of i.n. anti-NK1.1 Ab (days 0 and 1) on expression of Ifng transcripts by BAL fluid cells of Df-treated WT mice. (C) Ifng expression by the BAL fluid cells from WT and Cd1d–/– mice on day 2. (D) Lymphocyte subsets in BAL fluid obtained from Df-treated +/+ and P2ry6fl/fl/Cre/+ mice after the second dose of Df. Representative plots are shown and quantitated in the bar graphs (+/+: n = 4; +/+ Df: n = 7; and P2ry6fl/fl/Cre/+ Df: n = 6). (E) Effect of anti-NK1.1 Ab treatment at sensitization (days 0 and 1) on BAL fluid cell counts on day 16. Data are from 3 experiments. Values are mean ± SEM. *P < 0.05, **P < 0.01 by 1-way ANOVA followed by Tukey’s multiple-comparisons test.

