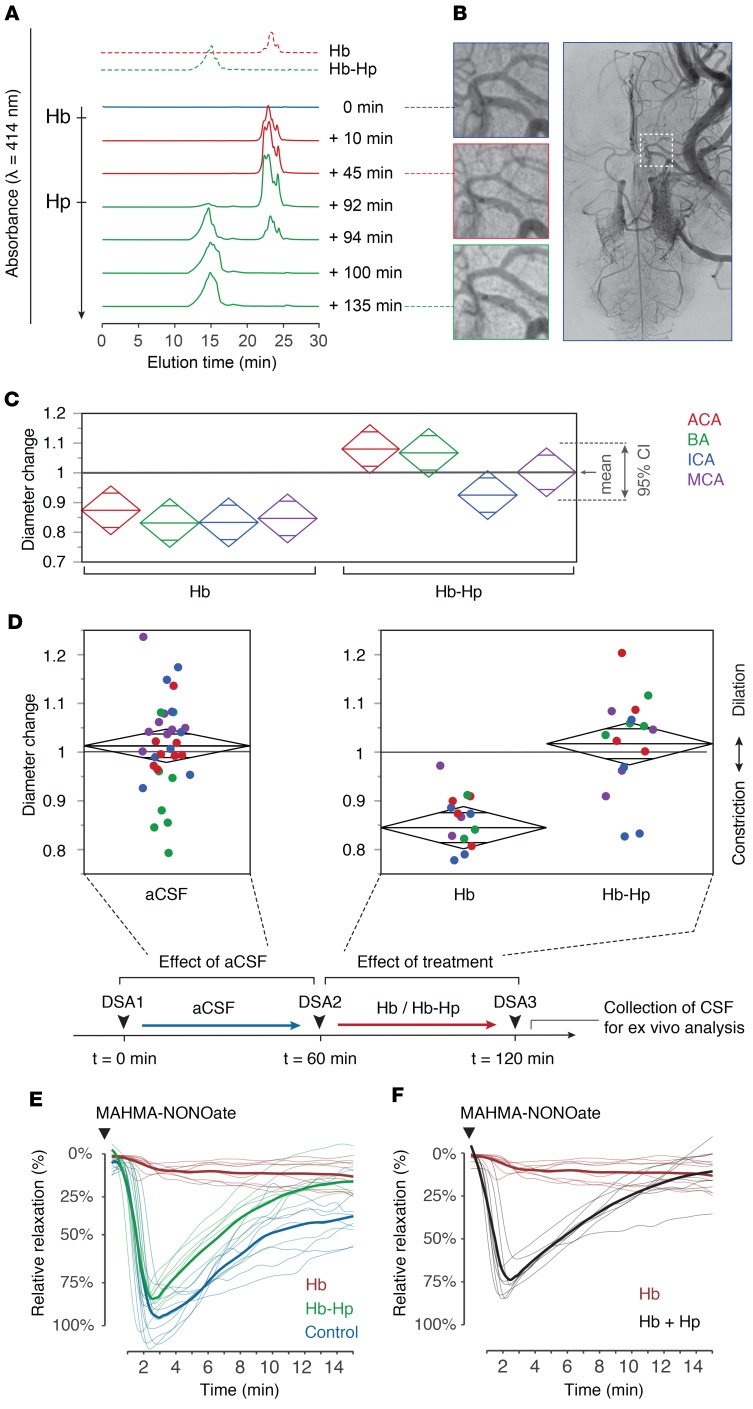
Figure 3. Hb-induced vasospasm of cerebral arteries and protection by haptoglobin.
(A) SEC elution profiles of CSF collected from the subarachnoid space at baseline (blue), after intraventricular infusion of Hb at t = 0 minutes (red), and after infusion of haptoglobin at t = 90 minutes (green). Standard elution profiles are shown on the top. (B) Angiograms of the middle cerebral artery (MCA) at baseline, 45 minutes after Hb infusion (t = 45 minutes) and 45 minutes after haptoglobin infusion (t = 135 minutes). The square in the far-right image indicates the position of the zoom-images. DSA images were obtained with a ×1.5 magnification. (C) Relative change in diameter of cerebral arteries 60 minutes after infusion of Hb or Hb-haptoglobin. ACA, anterior cerebral artery; BA, basilar artery; ICA, internal carotid artery. Diamonds represent the mean and the 95% confidence interval (n = 4 sheep per group). (D) Cumulative analysis of the relative diameter changes of analyzed arterial segments 60 minutes after infusion of aCSF (n = 32), Hb (n = 16), or Hb-haptoglobin (n = 16). Colors represent vascular areas defined in C. Group means were compared by 1-way ANOVA, P < 0.001. The scheme depicts the experimental protocol. (E) NO-mediated relaxation profiles (n = 8 per condition) of porcine basilar arteries immersed in sheep CSF collected after the 60-minute posttreatment angiograms. Blue line: CSF samples after infusion of artificial CSF (CSF-heme 0 μM). Red line: CSF samples after infusion of Hb (CSF-heme 200–240 μM). Green line: CSF samples after infusion of Hb-haptoglobin (CSF-heme 200–240 μM). Thick lines represent the treatment group means. Dilatory responses were induced with a single bolus of MAHMA-NONOate. (F) Addition of equimolar haptoglobin to the Hb-containing sheep CSF restored the dilatative response to MAHMA-NONOate. Red line: before haptoglobin addition, same CSF as in E. Black line: after haptoglobin addition. Thick lines represent treatment group means of relaxation profiles (n = 8).

