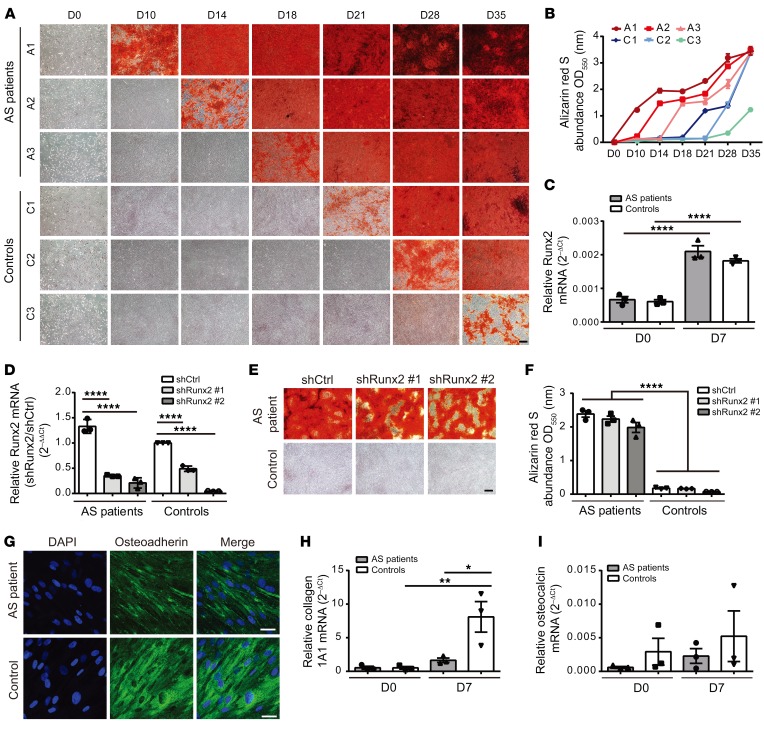
Figure 1. Runx2-independent accelerated mineralization in AS MSCs.
(A) ARS staining of enhanced mineralization in AS MSCs cultured under osteogenic conditions at the indicated days compared with control MSCs. (B) Quantification of ARS staining showing the differential rate in mineralization between AS MSCs and control MSCs at the indicated days. (C) RT-qPCR of Runx2 mRNA levels in AS MSCs and control MSCs at days 0 and 7 under osteogenic induction. (D–F) MSCs were transduced with lentiviral vectors carrying 2 independent shRNAs against Runx2 (shRunx2) or control shRNA (shCtrl) under osteogenic conditions. (D) RT-qPCR showing the knockdown efficiency by shRunx2 in AS MSCs and control MSCs at day 7 under osteogenic induction, normalized to the value of control MSCs expressing shCtrl. (E) ARS staining showing the effects of Runx2 knockdown on the mineralization of AS MSCs and control MSCs with quantification (F) at day 18 under osteogenic induction. (G) Immunofluorescence staining of AS MSCs and control MSCs at day 14 under osteogenic induction with DAPI (blue) and osteoadherin-specific antibody (green). (H and I) RT-qPCR of collagen 1A1 (H) and osteocalcin (I) mRNA levels in AS MSCs and control MSCs at days 0 and 7 under osteogenic induction. All experiments were done in the AS patient group using AS MSCs (derived from A1, A2, and A3 with experimental triplicates) and in the control group using control MSCs (derived from C1, C2, and C3 with experimental triplicates). Data are shown as the mean ± SEM. *P < 0.05; **P < 0.01; ****P < 0.0001 by 1-way ANOVA, followed by Tukey’s honestly significant difference (HSD) test. Representative images from AS (A1) MSCs and control (C3) MSCs are shown in E and G. Scale bars: 200 μm (A and E); 20 μm (G).

