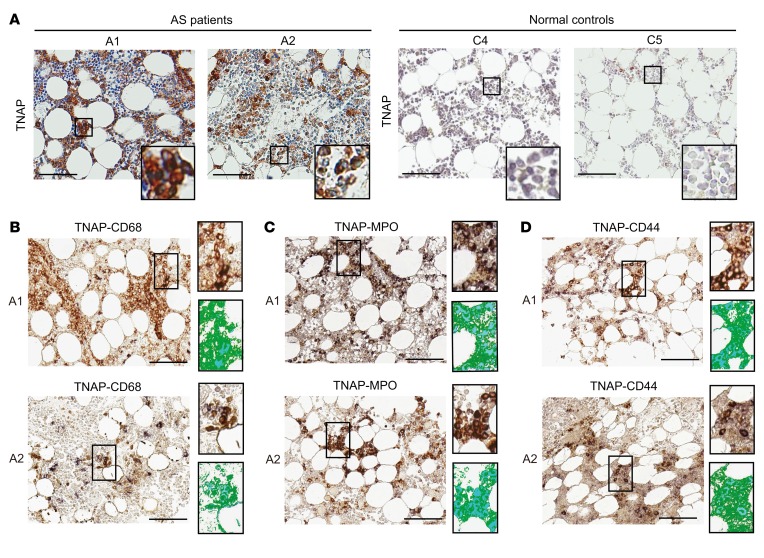
Figure 4. TNAP in the BM from AS patients is enhanced significantly in comparison with controls.
(A) IHC staining of the BM from AS patients (A1 and A2) and normal controls (C4 and C5) with a TNAP-specific antibody. Inset represents high magnification of the boxed area. (B–D) Double IHC staining of BM sections from AS patients (A1 and A2) with TNAP antibody (in brown) and the indicated second primary antibodies (in blue). The colocalizations of TNAP/CD68 (monocyte lineage) (B), TNAP/myeloperoxidase (MPO) (myeloid lineage) (C), and TNAP/CD44 (MSC) (D) were visualized as dark purple. Inset represents high magnification of the boxed area; top image is the microscopic image, and bottom image is the composite pseudocolored image by spectral unmixing technique with a spectral library (staining with TNAP antibody in brown and secondary antibody in blue). The colocalizations of TNAP/CD68, TNAP/MPO, and TNAP/CD44 are presented as turquoise. Scale bars: 100 μm (A–D).

