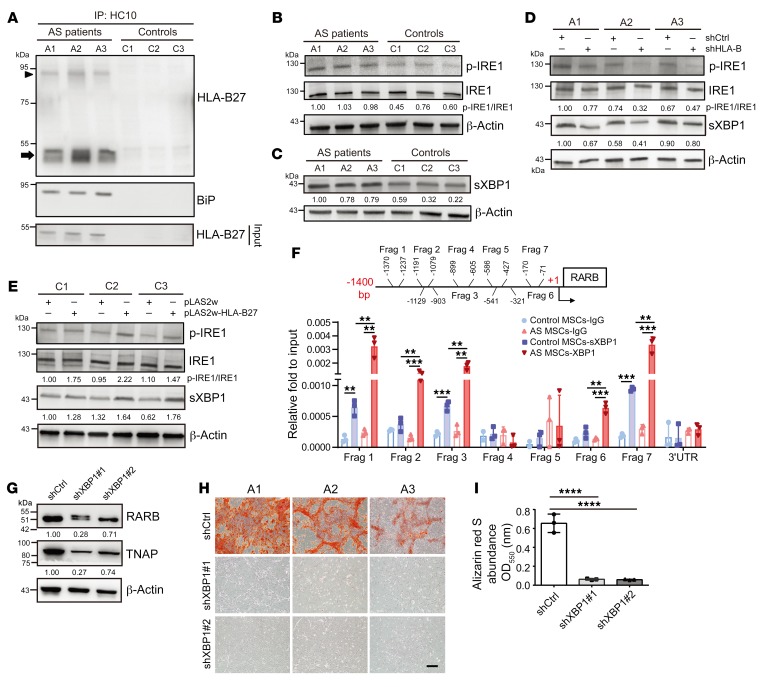
Figure 7. The HLA-B27–mediated activation of the p-IRE1/sXBP1 pathway promotes the upregulation of the RARB/TNAP axis in AS MSCs.
(A) Unfolded or misfolded HCs were immunoprecipitated (IP) from lysates of AS MSCs and control MSCs with HC10 antibody, followed by immunoblotting with HLA-B27 and anti-BiP antibodies. In AS MSCs, monomers of HLA-B27 HCs and dimers of disulfide-linked HLA-B27 HCs are indicated by an arrow and an arrowhead, respectively. (B and C) Immunoblot showing the expressions of p-IRE1 (B) and sXBP1 (C) protein in AS and control MSCs at day 7 under osteogenic induction. (D) Immunoblot showing the expressions of p-IRE1 and sXBP1 in AS MSCs transduced with shHLA-B or shCtrl. (E) Immunoblot showing the expressions of p-IRE1 and sXBP1 protein in control MSCs transduced with pLAS2w-HLA-B27 or pLAS2w. (F) ChIP assay showing sXBP1 binding at fragments (Frags) 1, 2, 3, 6, and 7 within 1400 bp upstream of the RARB transcriptional start site in AS MSCs. RARB 3′-untranslated region (3′UTR) was used as the negative control locus. (G) Immunoblot showing the expressions of RARB and TNAP in AS MSCs expressing shXBP1 or shCtrl. (H) ARS staining of mineralization in AS MSCs transduced with shXBP1 or shCtrl under osteogenic induction with quantification (I). All experiments done in the AS patient group and control group are from AS MSCs (A1, A2, and A3) and control MSCs (C1, C2, and C3), respectively, with at least 2–3 experimental repeats. Data are the mean ± SEM. **P < 0.05; ***P < 0.001; ****P < 0.0001 by 2-tailed Student’s t test (2 groups) or ****P < 0.0001 by 1-way ANOVA, followed by Tukey’s HSD test. Representative immunoblots from AS (A1) MSCs are shown in G.

