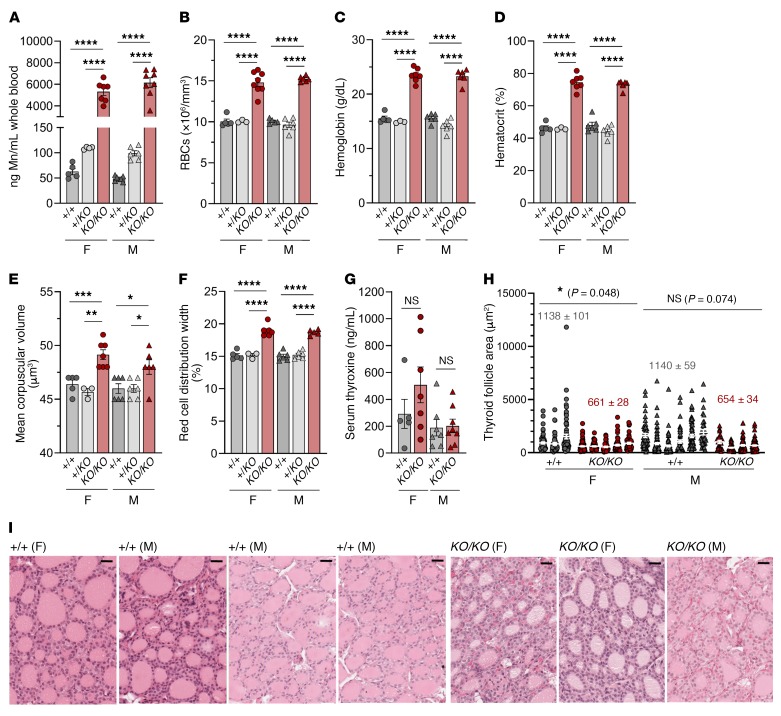
Figure 2. Slc30a10-deficient mice have increased RBC parameters and mild thyroid pathology.
Eight-week-old Slc30a10+/+, Slc30a10+/KO, and Slc30a10KO/KO mice were characterized for (A) blood Mn levels; (B) RBC counts; (C) hemoglobin levels; (D) hematocrit levels; (E) mean corpuscular volumes; (F) red cell distribution widths; and (G) thyroxine (T4) levels. For A–G, P values were calculated by 1-way ANOVA with Tukey’s multiple comparisons test. No outliers were identified by ROUT. Data are presented as individual values and represent the mean ± SEM. n = 5–9 replicates/group, except for female Slc30a10+/KO mice (n = 3–4). *P < 0.05, **P < 0.01, ***P < 0.001, and ****P < 0.0001. (H) Thyroid follicle area. Each vertical group represents 1 mouse, with each point representing 1 follicle (n = 21–96 follicles/mouse). The mean ± SEM for each mouse is shown with white bars and lines. The numbers above the groups represent the mean ± SEM for each sex and genotype. Two-tailed P values were calculated by nested t test. (I) H&E-stained images of thyroid. Original magnification, ×40; scale bars: 25 μm.

