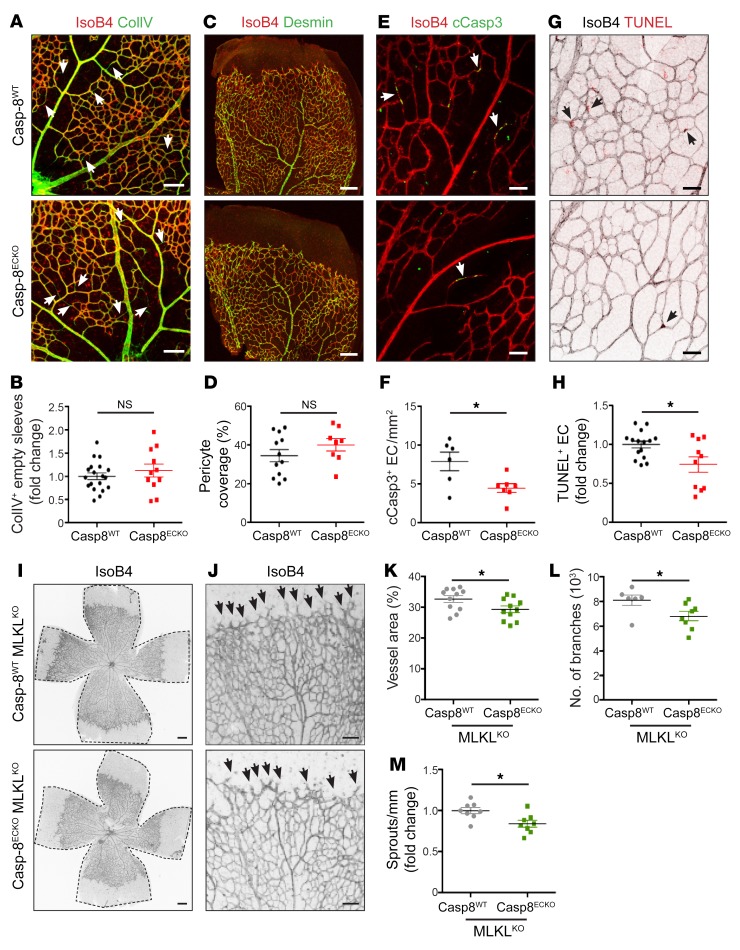
Figure 2. Loss of Casp-8 in ECs does not result in vessel regression or necroptosis.
(A) Retinas from P6 pups were costained with IsoB4 and collagen IV (ColIV) in Casp-8WT and Casp-8ECKO retinas. White arrows point to ColIV+IsoB4– empty sleeves. (B) Quantification of relative vessel regression shows no significant differences between genotypes (n = 19 WT, n = 11 ECKO). (C) Representative images of pericyte coverage. Retinas were costained with desmin (pericyte marker) and IsoB4. (D) Quantification of Desmin+ area per vascular area (%) shows no significant differences between genotypes (n = 12 WT, n = 8 ECKO). (E) Representative images of apoptotic ECs (white arrows), costained with IsoB4 and cCasp-3. (F) Quantification of cCasp-3+IsoB4+ cells per vessel area revealing fewer apoptotic ECs in Casp-8ECKO retinas compared with Casp-8WT (n = 6 WT, n = 7 ECKO). (G) Representative images of retinas costained with IsoB4 and TUNEL (black arrows point to TUNEL+ ECs). Images showing IsoB4 were transformed to gray colors with ImageJ for better visualization. (H) Quantification of relative amount of TUNEL+ ECs per vessel area also shows decreased numbers of apoptotic ECs in Casp-8ECKO retinas (n = 15 WT, n = 10 ECKO). (I and J) Representative images of the retinal vasculature stained with IsoB4 in Casp-8WT/MLKLKO and Casp-8ECKO/MLKLKO mice. Black arrows point to EC sprouts. (K–M) Quantitative analysis showing reduced vessel area (K; n = 11 WT, n = 11 ECKO), number of branches (L; n = 6 WT, n = 8 ECKO), and reduced number of sprouts per front area (M; n = 6 WT, n = 8 ECKO) in Casp-8ECKO/MLKLKO retinas compared with Casp-8WT/MLKLKO littermates. For B, D, F, H, and K–M, data are shown as mean ± SEM from at least 3 independent litters. *P < 0.05, 2-tailed unpaired Student’s t test. Scale bars: 100 μm (A, C, and I); 20 μm (E and G); 50 μm (J).

