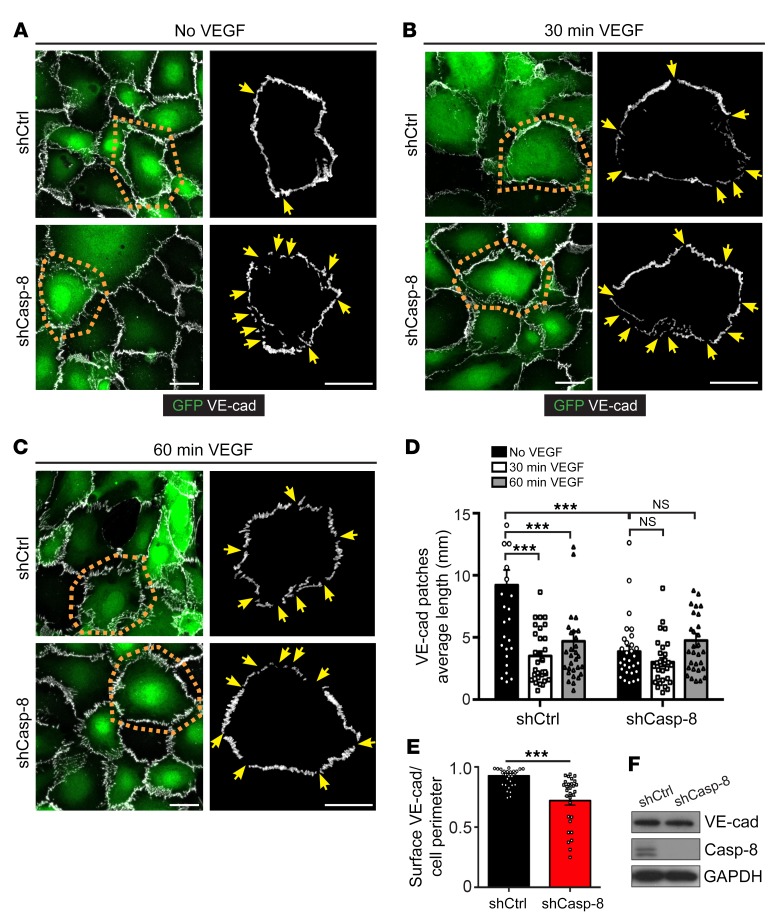
Figure 5. VE-cadherin distribution in ECs is affected in the absence of Casp-8 in vitro.
(A–C) Representative images of VE-cadherin (VE-cad) staining in confluent HUVECs infected with shCtrl or shCasp-8 lentivirus (GFP+) with (B and C) or without (A) VEGF (50 ng/ml) stimulation. Results of tracing VE-cadherin staining of the single cells within orange dotted insets is shown in the adjacent right panels. Yellow arrows point to empty VE-cadherin spots. (D) Quantification of the average length of VE-cadherin patches showing that VEGF-induced VE-cadherin reorganization is impaired in Casp-8KD ECs. ***P < 0.001, 2-way ANOVA with Bonferroni’s multiple comparisons test. (E) Quantification of the total amount of VE-cadherin per cell perimeter showing less VE-cadherin in Casp-8KD ECs. ***P < 0.001, 2-tailed unpaired Student’s t test. (F) Western blot showing unchanged total VE-cadherin protein levels in HUVECs infected with shCtrl or shCasp-8. For D and E, at least 15 cells per condition were quantified. n = 3. Data are shown as mean ± SEM. Scale bars: 20 μm (A–C).

