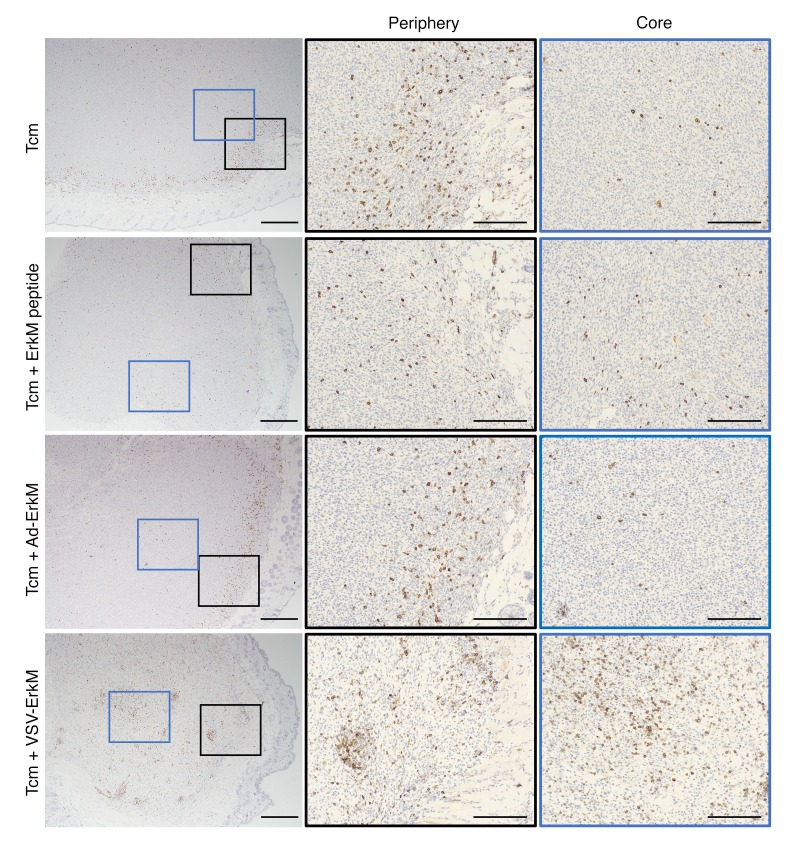
Figure 2. OVV treatment drives tumor core infiltration of transferred CD8+ T cells.
Micrographs of CMS5 tumor tissues stained with an anti-CD8 antibody show relative infiltration of the tumor core and periphery with T cells induced by the indicated treatments. Low-magnification images of the whole tumor are shown in left panels, and higher magnification images of the tumor periphery (outlined by black boxes) and tumor core (outlined by blue boxes) are shown in the center and right panels. Scale bars: 500 μm (left panels); 200 μm (center and right panels).

