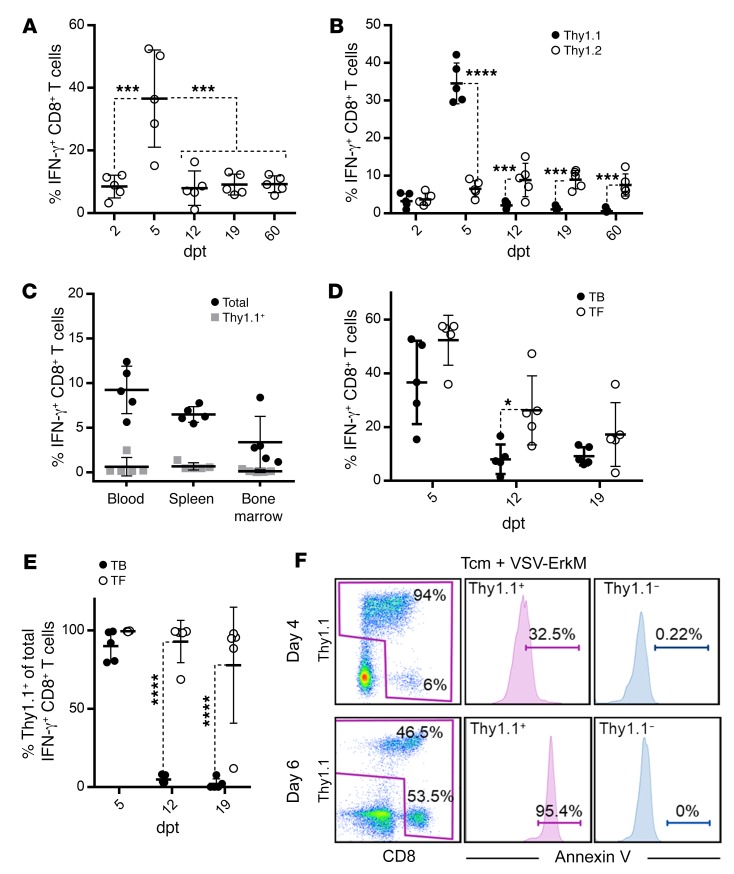
Figure 3. Expansion and persistence of ErkM-reactive CD8+ T cells are influenced by tumor during combination therapy.
(A) Venous blood was collected on the designated dpt. Virus component of combination therapy and frequency of ErkM-specific CD8+ T cell responses were evaluated. (B) Proportion of adoptively transferred versus endogenous cells within the total pool of ErkM-specific CD8+ T cells in circulation was determined by antibodies specific for Thy1.1 (transferred) and Thy1.2 (endogenous) in gated IFN-γ+ cells at the time points indicated. (C) CD8+ T cells collected from blood, spleen, and bone marrow of mice 60 days after CMS5 tumor regression induced by combination therapy were assessed for ErkM specificity. Black dots represent total frequency of ErkM-specific CD8+ T cells, and superimposed gray boxes represent frequency of transferred ErkM-specific CD8+ T cells. (D) Magnitude of ErkM-specific CD8+ T cell responses and (E) frequency of Thy1.1+ T cells in the total pool of ErkM-specific CD8+ T cells in the circulation of TB and TF mice as assessed at time points indicated. (F) Representative flow cytometry profiles of tumor-infiltrating CD8+ T cells costained for Thy1.1 and annexin V on days 4 and 6 after vaccination are shown. Data are representative of results of 3 (A and B) or 2 (C–F) independent experiments with n = 5 per group. Data were analyzed using 1-way ANOVA (A), 2-tailed t test (C), or repeated measures 2-way ANOVA with Holm-Šidák correction for multiple comparisons (B, D, and E). *P < 0.05; ***P < 0.001; ****P < 0.0001.

