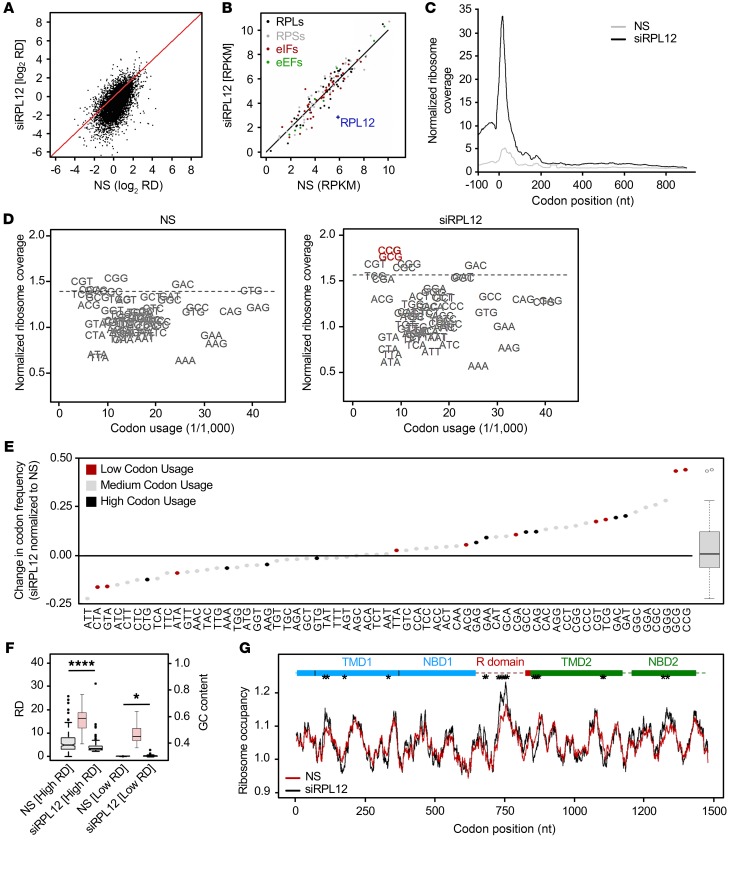
Figure 2. RPL12 suppression slows translation rate in CFBE.
(A) Comparison of RD values for CFBE F508del-CFTR cells treated with RPL12-directed siRNA (siRPL12) or NS siRNA from ribosome-profiling data. Diagonal denotes the position of equivalent RD values. (B) Expression of specific translational machinery proteins assessed by ribosome profiling. RPLs, ribosomal proteins (large subunit); RPSs, ribosomal proteins (small subunit); eIFs, eukaryotic initiation factors. (C) Cumulative metagene profiles of RPFs as a function of position for all protein-coding genes detected over the threshold from ribosome profiling. Each transcript was weighted equally. Zero designates the first nucleotide of the start codon. (D) Ribosome-dwelling occupancy for cells treated with siRPL12 or NS siRNA as determined from ribosome profiling and compared with genome codon usage. Dashed line denotes the upper boundary (90% confidence interval). (E) Difference in ribosome occupancy (y axis) between NS and siRPL12-treated cells quantified from D for single codons (represented as dots) and for all codons (box plot on right). Top 10 most (black) or least (red) utilized codons are annotated. (F) Box plot of 200 most (high RD; P = 3.0 × 10⁻⁷) and least (low RD; P = 0.045) expressed genes in NS and siRPL12-treated cells. GC content of high- and low-RD groups is represented in red (right y axis). *P < 0.05; ****P < 0.0001, Wilcoxon’s rank sum test. (G) Profiles of ribosome-dwelling occupancy computed from D for CFTR mRNA in NS and siRPL12-treated cells. Single codons exhibiting an occupancy variance greater than the 95th percentile (*) are considered statistically significant.

