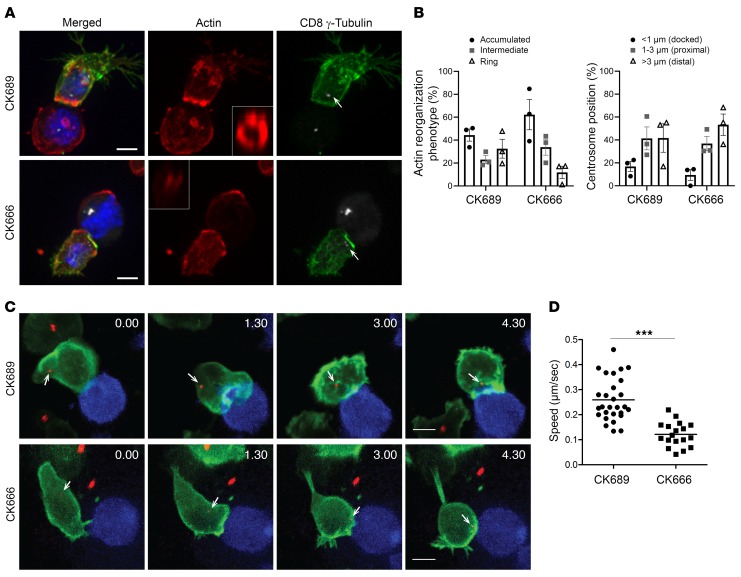
Figure 3. Arp2/3 inhibition impairs actin dynamics in CTLs.
(A) Confocal projections of OT-I CTLs treated with 90 μM of CK689 or CK666 mixed with OVA-loaded EL4 for 25 minutes; cells were fixed and labeled with antibodies against CD8 (green), actin (red), and γ-tubulin (white) to mark the centrosome (white arrows). A representative 3D reconstruction of en face interaction (white box) of the actin phenotype at the interface between the OT-I CTLs and its target. Scale bars: 5 μm. (B) Quantitation derived from images as exemplified in A and showing the percentages of conjugates displaying the different actin reorganization phenotypes at the synapse (left panel, see Supplemental Figure 1) or the centrosome distance relative to the synapse (right panel: CK689 CTLs = 190, conjugates = 91, CK666 CTLs = 179, conjugates = 80, mean of 3 independent experiments, error bars indicate SEM). (C) Actin dynamics and centrosome position (white arrows) in OT-I CTLs expressing EGFP-Lifeact (green) and PACT-mRFP (red) during interaction with EL4 blue at various time point (min:s) from the first contact. Images are confocal projections from Supplemental Videos 1 and 2. Scale bars: 5 μm. (D) OT-I CTL motility while migrating on ICAM-1 following treatment with 90 μM CK666 or CK689. The speeds of cell migration were analyzed with time-lapse images (see Methods). The graph includes plots of 28 cells for CK689 and 18 cells for CK666 from 3 videos each. ***P < 0.0001, unpaired t test.

