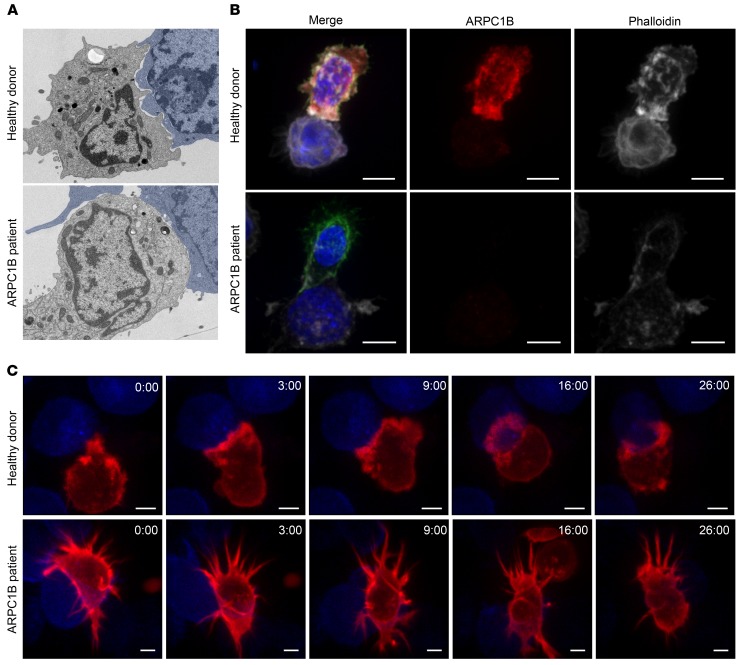
Figure 5. Electron and light microscopy reveal atypical synapse formation by ARPC1B-deficient hCTLs.
(A) Electron micrograph of HD and ARPC1B patient hCTLs conjugated to P815 target cells (false colored in blue) for 25 minutes. (B) hCTLs from HD and ARPC1B-deficient patient were conjugated to blue P815 target cells, fixed, and labeled with anti-CD8 (green) and anti-ARPC1B (red) antibodies and phalloidin (white). 3D reconstructions of Z-stack are shown. Scale bars: 3 μm. Data are representative of 3 independent experiments (A and B). (C) Actin dynamics in HD and ARPC1B-deficient patient hCTLs expressing mApple-Lifeact (red) during interaction with blue P815 target cells. Images are single confocal slice from Video 3 at the indicated time points (min:s) from the first contact. Data are representative of 5 independent experiments. Scale bars: 5 μm.

