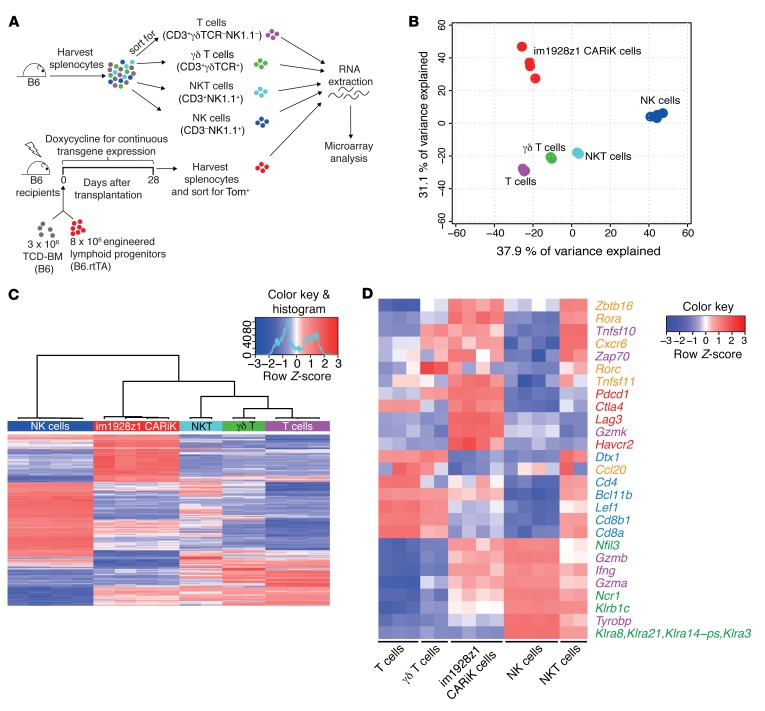
Figure 4. Transcriptional profile analysis locates CARiK cells at the interface of T lymphocytes and NK cells.
(A) Schematic representation of the experimental setup for transcriptional comparison of CARiK cells and different lymphoid cell populations. Splenocytes of 12-week-old WT B6 mice were harvested and sorted for T cells (CD3+γδTCR–NK1.1–; n = 3), NKT cells (CD3+NK1.1+; n = 2), γδ T cells (CD3+γδTCR+; n = 2), and NK cells (CD3–NK1.1+; n = 4). Tom+ CARiK cells (n = 4) were harvested from recipients on day 28 and consecutively sorted. Extracted RNA samples from all lymphoid subsets were compared by microarray analysis. Experiment was performed once. (B) PCA analysis of transcriptional profiles derived from the sorted lymphoid cell populations. (C) Hierarchical clustering of the 500 most differentially expressed (adjusted P < 0.05) transcripts across CARiK cells and respective lymphoid lineages. (D) Selected transcripts expressed by lymphoid subsets were color coded according to function or lymphoid cell type. Orange: γδ T cells, NKT cells, and innate lymphocytes; purple: cytotoxicity mediators; red: inhibitory receptors; blue: T lymphocytes; green: NK cells.

