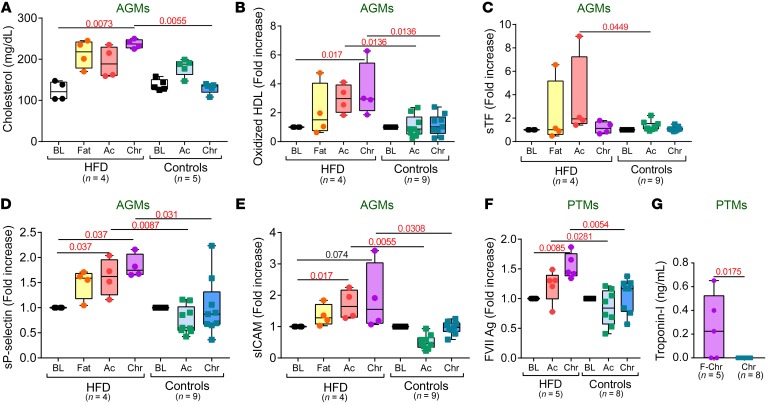
Figure 9. HFD increases thrombotic cardiovascular risk in SIV-infected NHPs.
Serum cholesterol values (A), fold increase of plasma oxidized HDL (B), soluble tissue factor (C), soluble p-selectin (D), and soluble ICAM-1 levels (E) to baseline levels in AGMs, as well as fold increase of factor VII levels to baseline levels in PTMs (F) are compared at key time points of SIV infection within HFD group with Friedman test corrected for multiple comparisons, and between HFD and control groups with Kruskal-Wallis test. (G) Plasma troponin-I levels during chronic infection in PTM are compared between HFD and control groups with Kruskal-Wallis test. Data are presented as individual values with medians. Sample size (n) and P values are presented on graphs. Ac, acute infection; BL, baseline (preinfection pre-HFD); Chr, chronic infection; Fat, preinfection post-HFD.

